During the pandemic, my daughter and I began watching Star Trek together. In the Picard and Discovery series, we were introduced to a Romulan sect called the Quowat Milat, a group of warrior nuns who practice the Way of Absolute Candor.
Why do I mention this in a blog on the AIA 2030 Commitment? 2022 was the sixth year VMDO reported our project performance data to the 2030 Design Data Exchange (DDx). Each year our results contain victories and defeats that remain untold—untold because we are not even close to hitting our 2030 goals portfolio-wide. Each year my mouse hovers over the checkbox next to “I consent to have AIA publish or share my company’s pEUI reduction publicly” and then moves on, because surely publishing results that are far from the goal is a bad thing, right?
I know that others are struggling, too. When I look at the results from the firms I admire, only a few publish their company’s pEUI reduction number, and even fewer provide a breakdown by typology. If you can find specific project information, it is couched as percent reduction (but what is the baseline?) or the data’s status is unclear (is it modeled or predicted).* Yet everyone who fills out the DDx has (at least) the predicted information at their fingertips.
Maybe it is time that more of us practice the Way of Absolute Candor.
This is going to be a lengthy post with a lot of information that I hope will be useful to others. Do not have the time right now? Here are the big messages I would like you to walk away with:
- Signing on to the 2030 Commitment has revolutionized how VMDO practices. If you have not signed on, you should.
- Data transparency is the only way we are going to learn from each other, and it is the best way to hold ourselves accountable. We should all be publishing our data whenever possible.
- Not every project is going to hit the 2030 target; it does not mean we should not try. Missing the target on a project is not necessarily a failure.
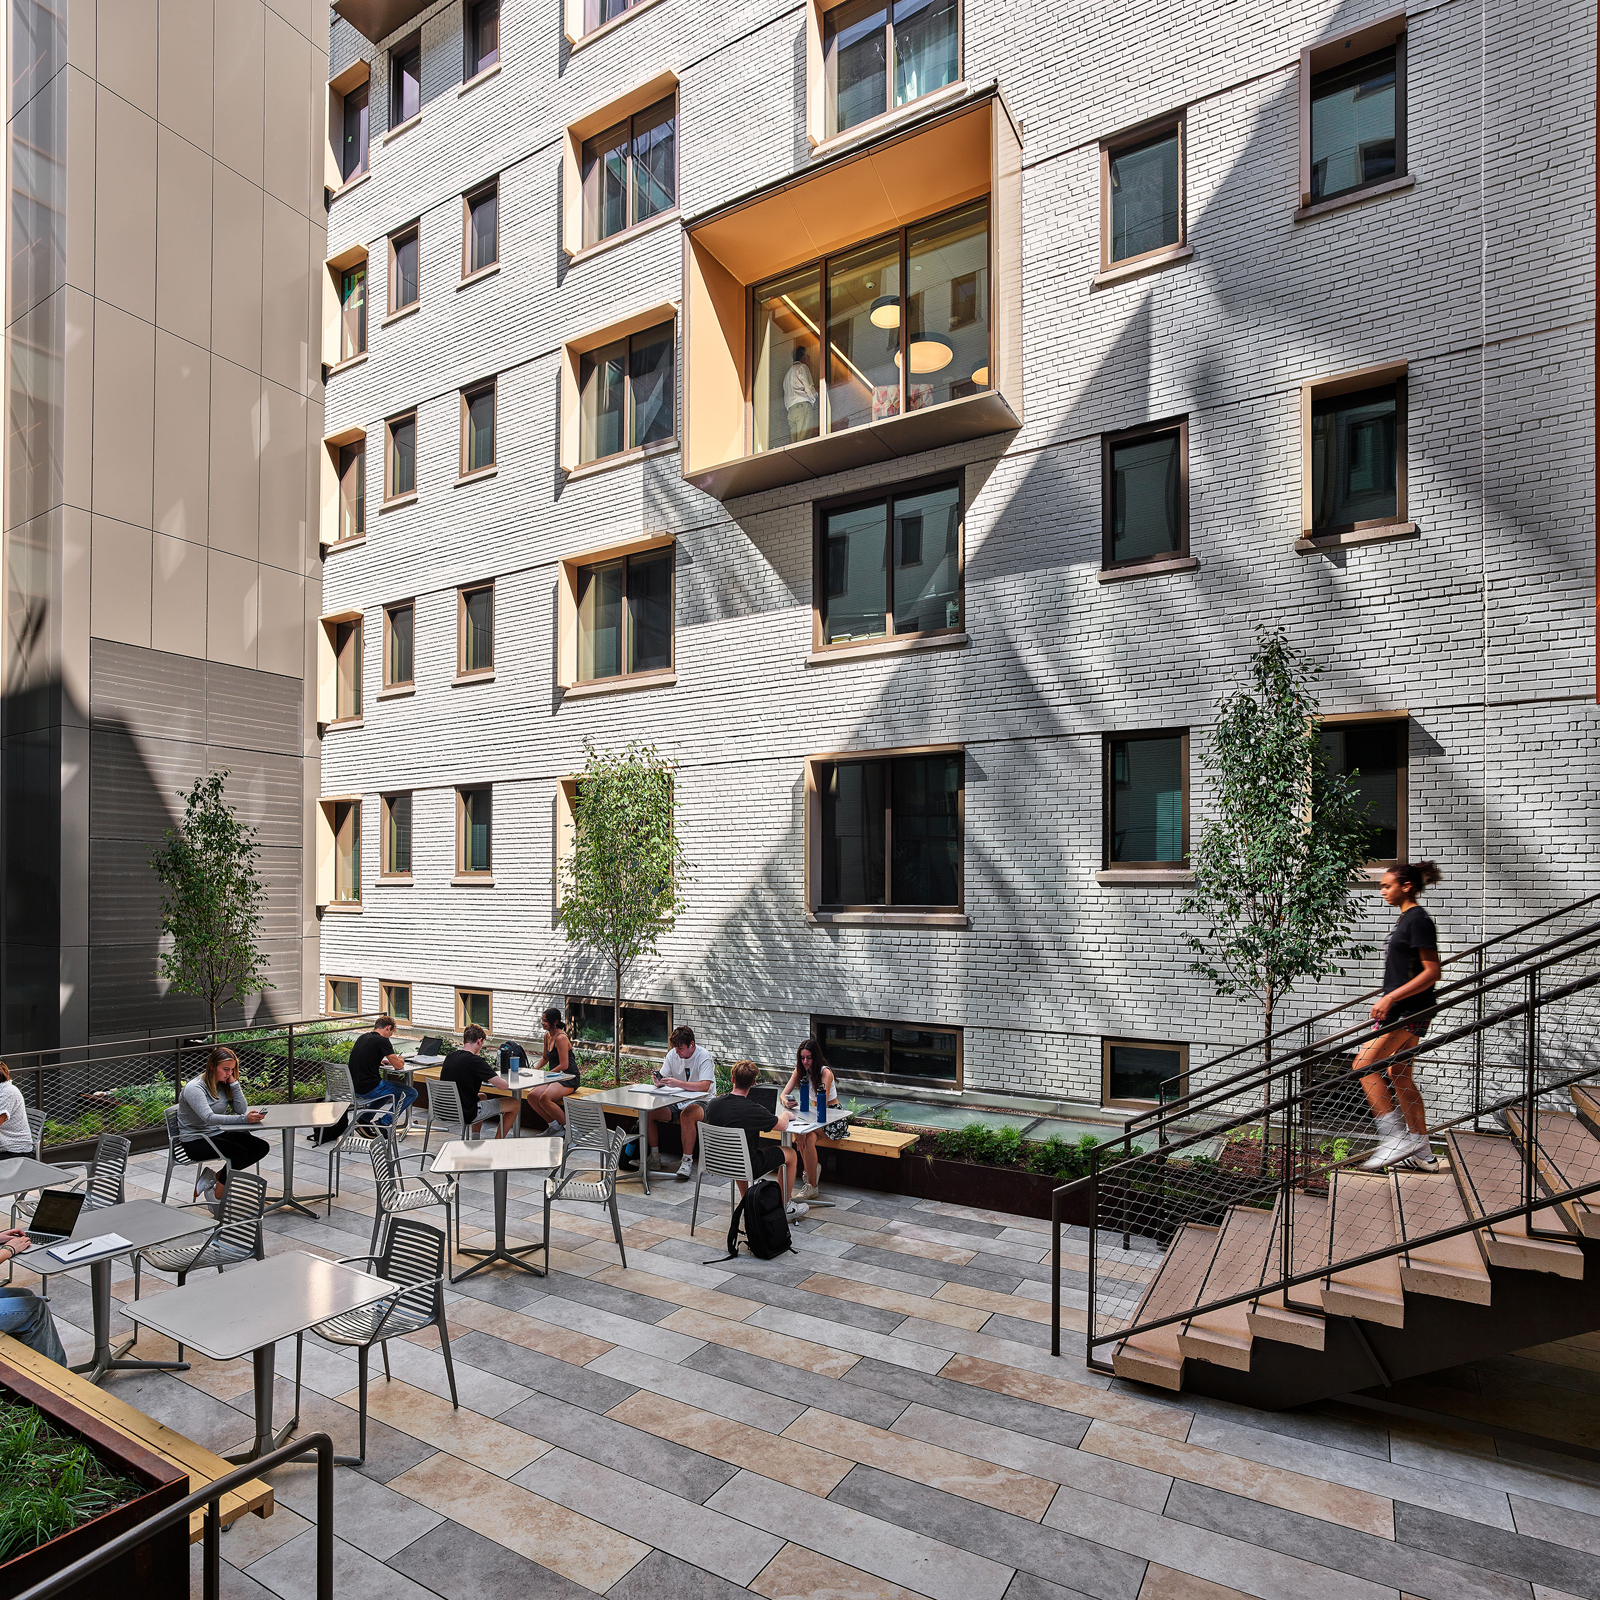
This Earth Day, we are trying something new at VMDO. Full, public transparency on everything we know about how our work is performing or how we anticipate it performing. Below is information on the pEUI for every project we reported on this year, along with typology and studio-based averaged metrics. We have updated the project pages on our website to include the energy performance information we have and we commit to continuing to update it regularly and sharing what we learn.
This year, I finally clicked that checkbox to make our data public when I submitted our 2022 portfolio to the DDx.
A word about baselines. The conversation around baselines has evolved since we first started reporting, and one sees a wide range of baselines cited in 2030 statistics published in our industry. As an example, in our first year of reporting we referenced the CBECS 2003 K12 national average (75 EUI) for our K12 projects. We now use the CBECs 2003 K12 regional average provided by Zero Tool (~56 EUI), per current recommendations in the AIA 2030 Design Data Exchange (DDx). The change in baseline is the difference between a 67% reduction and a 54% reduction for a 25 pEUI K12 project—so baselines really matter. At VMDO, for most typologies, we use the regional averages provided by Zero Tool.
Our exception to using Zero Tool baselines is residence life. Residence life is not well-represented in CBECS 2003: there are only 13 residence halls between 65,000-200,000 sf in the database and most were constructed before 1979. Because of the increased ventilation rates in residence halls required by current codes (most CBECS halls are unventilated) and the wide variability in energy demand based on typology/density (suite verses semi-suites verses traditional configurations), we rely on ASHRAE 90.1-2013 Appendix G to establish our 2030 baseline. For lighting power density baselines, we use the default values in the DDx which are the national averages by typology.
PART 1: FIRM-WIDE 2030 METRICS
Here are VMDO’s reported percent reductions for the last five years**:

This image begs the big question: We have been working on our 2030 Commitment for a while—why don’t we appear to be making progress?
- Changing portfolio mix: In 2018, our mix of projects contained 45% K12 work and 40% residence life. In 2022, this mix was radically different: 26% K12 work and 50% residence life. As a firm we do not do tenant improvement-type work. Why does this matter? Achieving 2030 targets on K12 or tenant improvements is much easier than on residence life for many reasons (more on this later).
- More renovations. In 2018, only 13% of our portfolio involved renovations; in 2022, it was 37%. While this is a great thing in terms of embodied carbon, these projects often mean connecting to existing (less efficient) infrastructure or, in partial renovations, reusing assemblies and/or equipment that we would not specify if building new.
- Better data. Those first years of reporting included “modeled” information that turned out to be educated guesses instead of actual models. These days we are much more rigorous about what has an actual model (and when) and use conservative default reductions, rather than estimated pEUIs, if projects do not have model or are following prescriptive pathways. Another huge shift in our portfolio is the number of clients pursuing on-site renewables via PPA (Power Purchase Agreement). If renewables are not in the construction budget, we do not include them in our reporting until there is a signed PPA and the array design is in-hand. That means several of our projected zero-energy projects do not show up as zero-energy in the DDx.
So, where are we making progress? Compare the summary between 2018 and 2022.
2018 VMDO DDX Results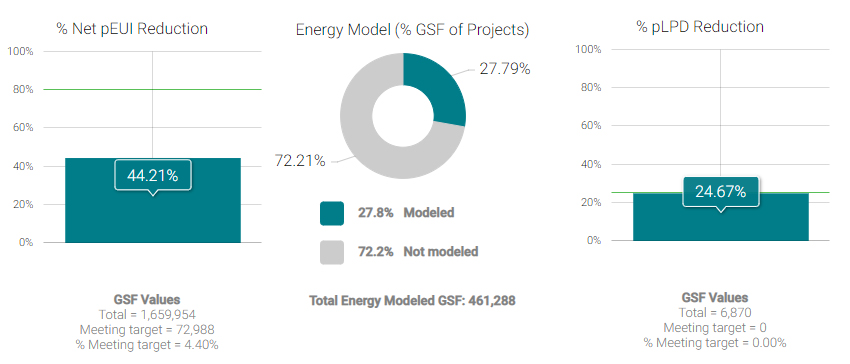
20 projects and 1,666,824 GSF included in analysis.
Interior-Only Projects: 1 project and 6,870 GSF included in analysis.
Whole-Building Projects: 19 projects and 1,659,954 GSF included in analysis.
2022 VMDO DDX Results
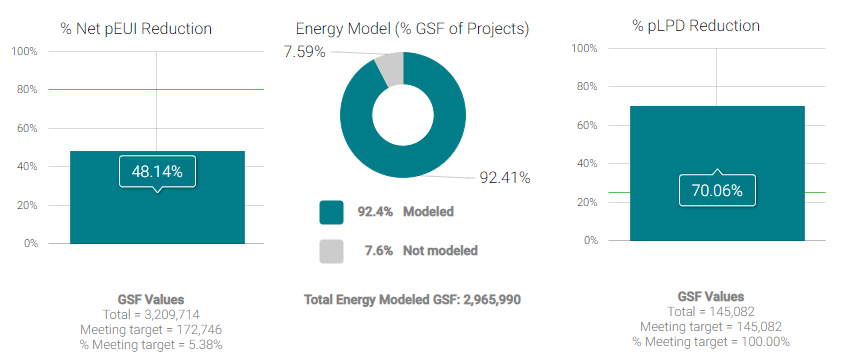
36 projects and 3,354,796 GSF included in analysis.
Interior-Only Projects: 5 projects and 145,082 GSF included in analysis.
Whole-Building Projects: 31 projects and 3,209,714 GSF included in analysis.
While our pEUI reduction has inched closer to our 2030 target, the biggest changes have been the massive increase in the square footage of projects with energy models and in projected lighting power density reduction. Again, there are major successes behind those metrics:
- The 2030 Commitment has revolutionized how we think about performance. Not only do more of our projects have energy models, but also performance discussions happen iteratively with our engineers (versus the energy model showing up at the end of the project). Our teams know what EUI stands for, are interested in window wall ratios, argue over the best details for air infiltration and thermal bridging, set benchmarks and target pEUIs at the beginning of the project, assess sites for geothermal and renewable production capacity —all independently of whether the client is “looking for sustainability.” We now have a vision of what we are shooting for, even if we do not achieve it every time.
- Another tremendous success is the increased number of projects and the gross square footage (more than double) in the analysis. More projects and more square footage with more modeling equals better understanding and, hopefully, improved performance.
- A few years of 2030 reporting helped us identify the biggest opportunity for improvements – residence halls. In 2020 we performed a Passive House gap analysis of what was our most recent residence hall and we have incorporated many of the findings in subsequent projects. Our average residence hall reduction (including four projects with significant dining components) was 42% in 2022, up from 32% in 2018 (using an identical approach to baselines).
- We also started favoring engineers who could work with us in an iterative manner and who could deliver the proven results we are looking for.
PART 2: OUR 2022 METRICS BY STUDIO
Firmwide numbers are one thing, but we will not continue to improve if we cannot talk specifically about typologies. VMDO consists of three studios, loosely based on typologies, and our DC office, which spans all typologies.
Our Athletics + Community Studio focuses on community centers, fitness, and sports (including Lubber Run Community Center, recipient of this year’s AIA Architecture Award). This studio also includes projects where we are architect of record for projects underway at the University of Virginia. Here is a snapshot of this studio’s performance over the past few years:

And here are the 2022 projects (with their respective design phases) reported under that studio:

Performance challenges in A+C include:
- The Architect of Record role we have played on a good portion of this studio’s square footage over the past few years—we do not have a lot of control over the design, so our role has been as advocate/resource for performance.
- As a typology, sports venues are difficult both to benchmark and to model given the ratio of conditioned to unconditioned space and irregular schedules. Our projects include all loads within the project boundary, including field lighting.
- The major design project in this studio, OMVHS, is a conversion of a historic former high school into a community center with a range of load profiles including a daycare and culinary incubator—difficult to model, and difficult to improve the historic building envelope performance given historic protections.
Changes between 2021 and 2022 that contribute to the drop in 2030 performance include two major higher-performing projects cycling off reporting after their 2021 completion (including one zero-energy project).
The Higher Education Studio works primarily on college campuses and includes labs, student centers, performing arts, classroom buildings, dining, and residence life. Here is a snapshot of the studio’s performance over the past few years:

Here are the 2022 projects (with their respective design phases) reported, divided into academic and residence life typologies:


Performance challenges in the Higher Ed studio over the past year include:
- Like the A+C Studio, we are Architect of Record on ODU Biology and do not have a lot of control over the design.
- We produced the criteria documents on UF Housing, but only have a light oversight role on the design/build team and thus not a lot of control over if and how performance strategies are implemented.
- Higher Education as a market is challenging because connections between performance investments and resulting cost savings are not necessarily delivered to the same divisions within the overall client. Similarly, an institution may have a performance mandate, but provide little in terms of additional funding or enforcement at the project level.
Changes between 2021 and 2022 that contribute to the improvement in 2030 performance include a significant improvement in dining (likely due to better modeling) at U Miami; and over 400,000 sf of new residence life projects with much more aggressive energy performance goals than previous projects. A known wild card is the performance of the dining hall at William and Mary, which has not yet been modeled and will depend on how that is programmed and designed. It could come back to haunt us because of the code-based default reduction that the DDx uses.
The K12 Studio works on all projects related to the K12 education sector, including small renovations, renovated and new elementary, middle, and high schools, and technical training centers for public and private clients. Here is a snapshot of this studio’s performance over the past few years:

And here are the 2022 projects (with their respective design phases) reported under the K12 Studio:

Performance challenges in the K12 studio over the past year include:
- Changes in the procurement of renewables. While all K12 facilities currently on the boards are zero-energy ready, most of the clients are providing arrays via Power Purchase Agreements (PPAs) that are not yet under contract. Often clients will wait until the building is complete before negotiating in earnest with the PPA provider. We saw many providers renegotiate their terms given supply chain stresses from COVID, and some districts walk away from agreements because the terms became too expensive.
- The growth in renovation work verses new construction and the change in delivery methods (such as the growth in design/build within our region’s K12 market) are evolving how we work.
- A number of K12 clients are moving away from LEED/certification, which makes integrated energy modeling with our engineers an additional investment and takes away a convenient lever for delivering project performance.
- As a side note, we have seen the Energy Use Intensities (EUIs) of our zero energy completed projects increase as much as 5 EUI since COVID because districts have not re-enabled demand-controlled ventilation, which is an upcoming challenge in terms of how clients will run our buildings once they are open.
Changes between 2021 and 2022 include three major projects cycling off reporting after their 2021 completion (including one zero-energy project), and one major zero-energy ready project becoming inactive. Countering those changes is Lancaster MS/HS, which is zero-energy and includes PVs within the base budget, resulting in a level performance even with all of the changes to the project mix.
The DC office works on all projects in the DC metro area, across all typologies. A relatively new studio, this is its first year of reporting on its own, with a 52.1% average reduction across of their projects. Here are the 2022 projects (with their respective design phases) reported under that studio:

Performance challenges for the DC office over the past year include:
- Renewables procurement: both Truesdell ES and Stead Park are contractually required to be zero-energy facilities, but because their PVs are being provided by PPA, and those agreements have not been finalized, we cannot count those renewables in our reporting.
- The runaway construction market this past year has been challenging in terms of maintaining project quality, particularly in our public work where budgets tend to be much tighter.
PART 2: OUR 2022 METRICS BY TYPOLOGY
Here are the same results as above, but this time cleanly broken down by typology:


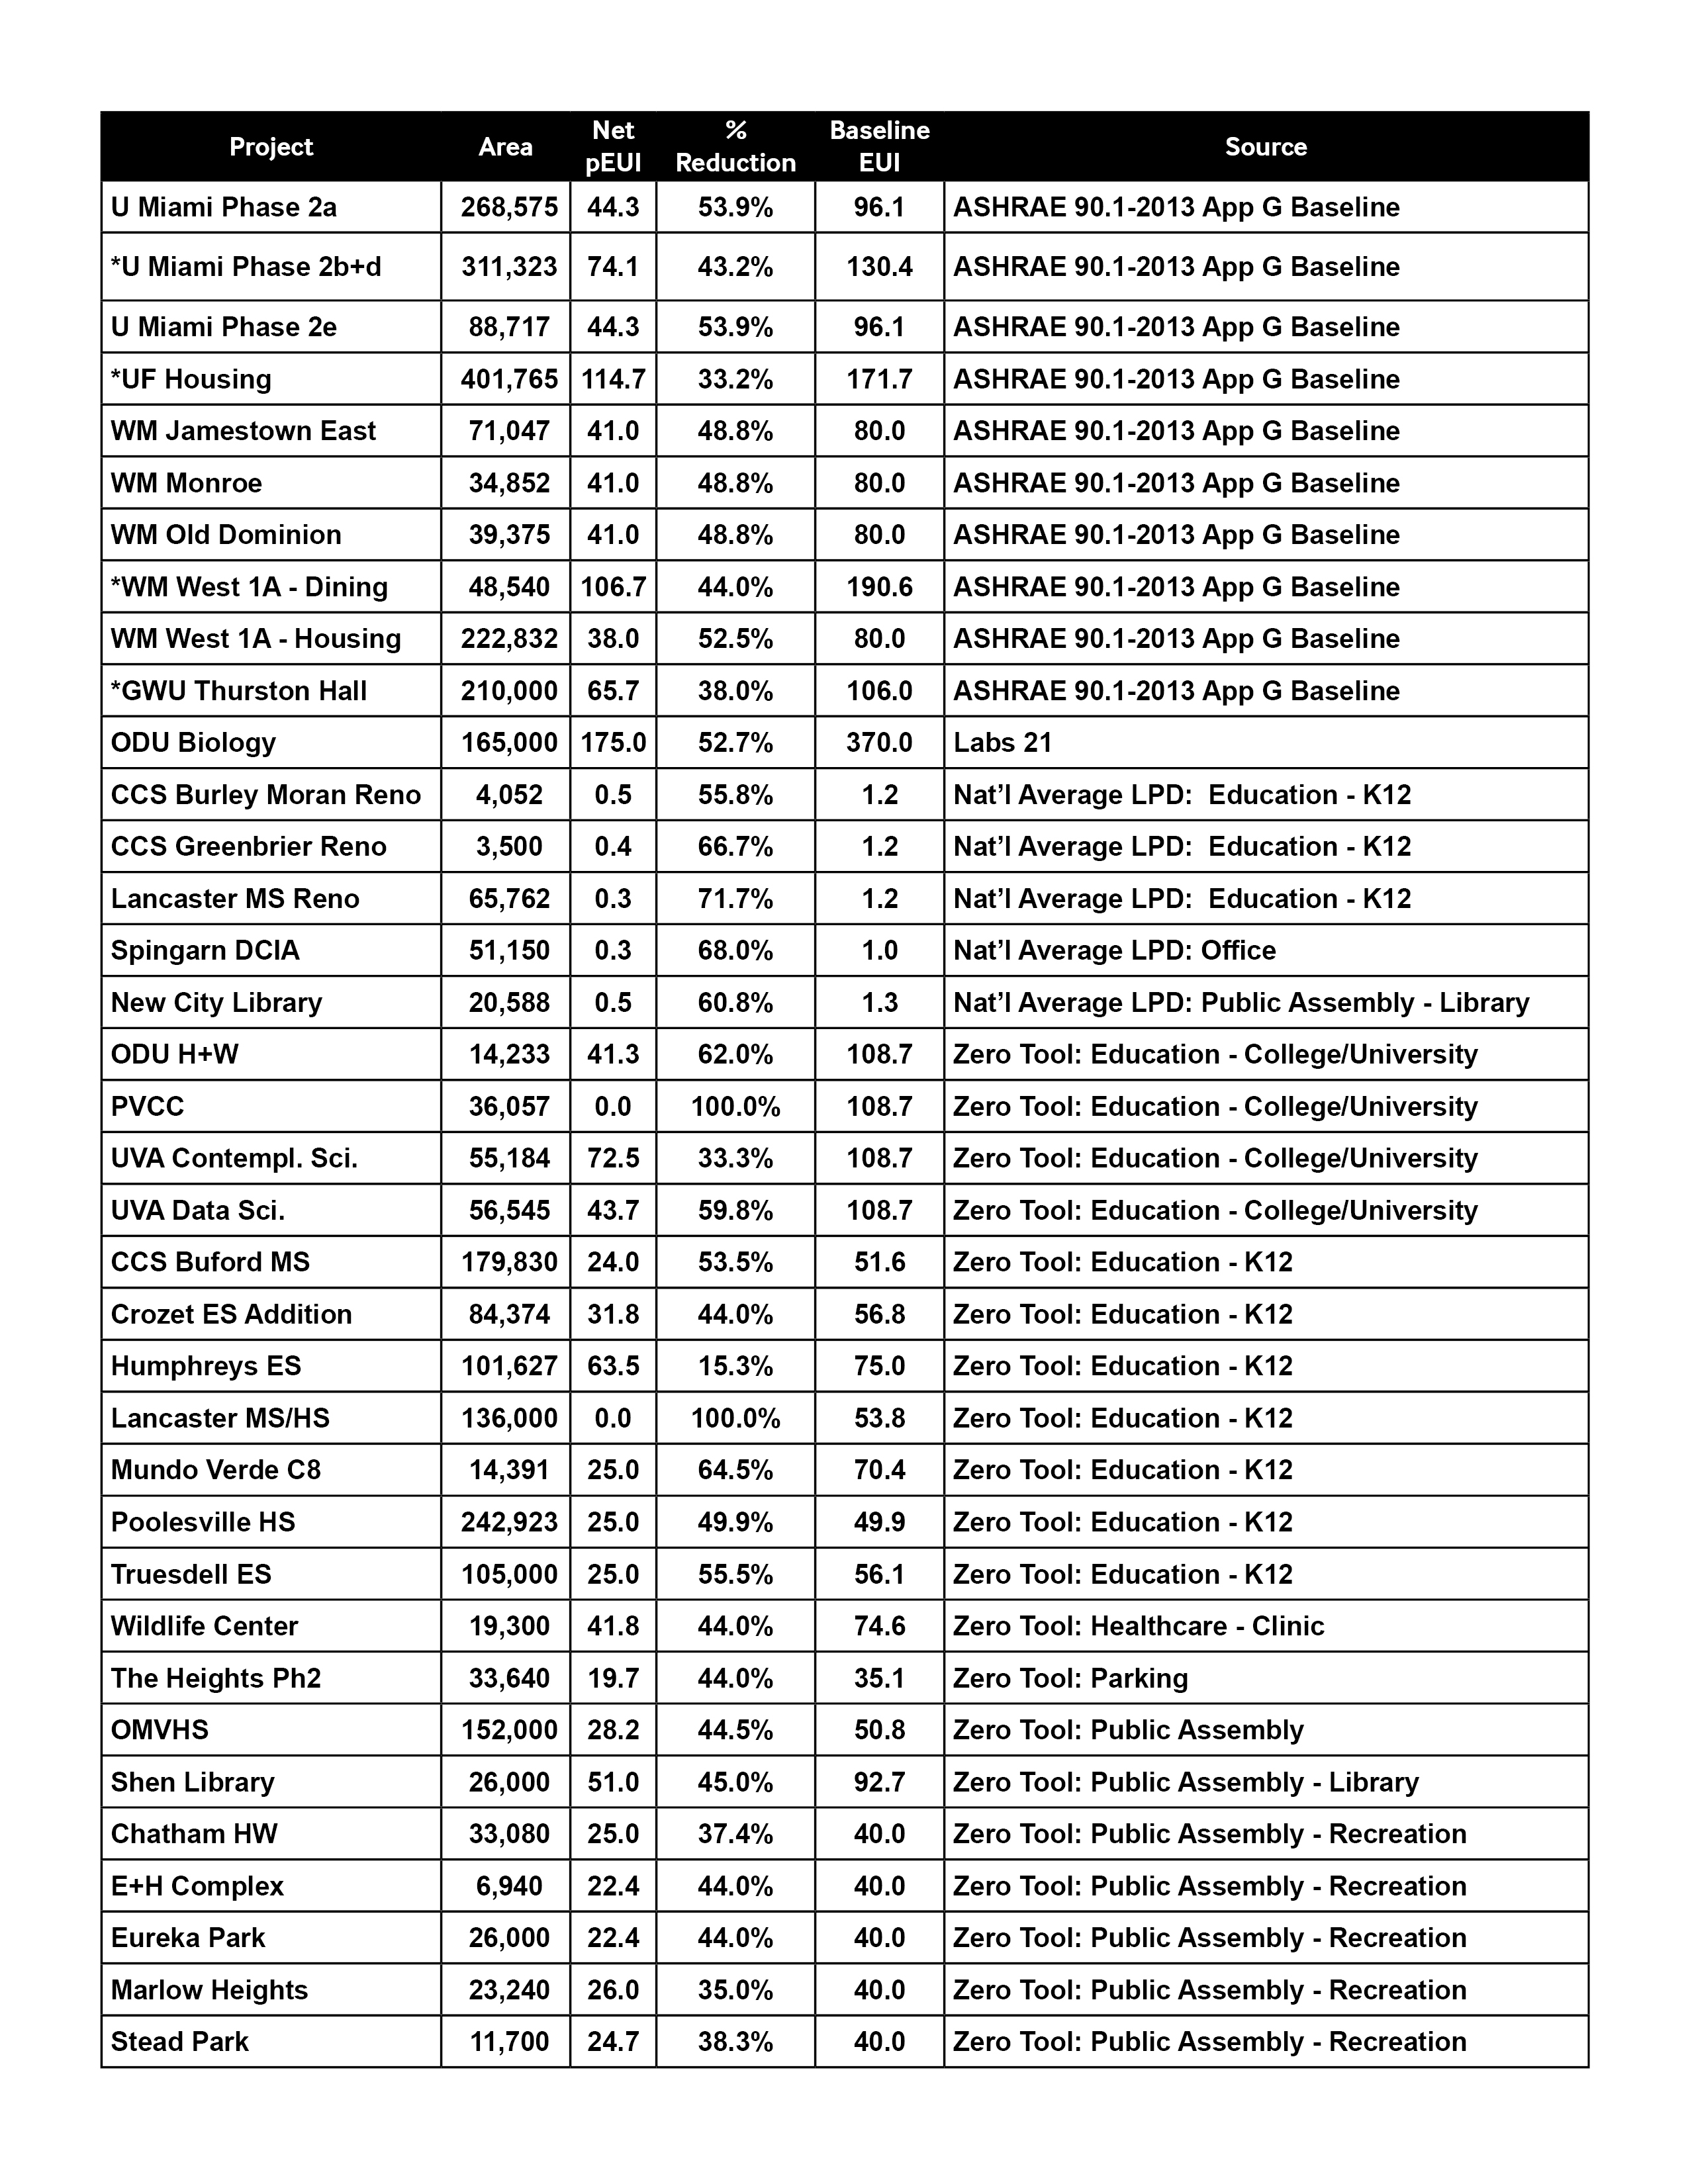
And in the interest of full transparency, here are the specifics for each project:
PART 4: WHAT’S NEXT?
The 2030 Commitment has spurred discussions about our role and responsibility when it comes to climate action, resilience, equity, and health. For example, after three years of not seeing our firmwide percent reduction number move significantly, we discussed whether we wanted to focus our business development efforts solely on clients who were already interested in or actively asking for climate action. This made us look deeply at how we measure success and impact beyond the DDx. Isn’t it valuable to take a client with no interest in sustainability to a point where they are fluent in the concepts and carrying them into their next project/current operations, even if the project does not achieve its 2030 target? Similarly, don’t communities everywhere deserve high-performing environments in which to live, work, and learn, whether or not they are fully committed to a carbon-neutral future? From VMDO, the answers to both questions were “yes.” Not meeting our 2030 target is not a failure if we are continuing to evolve our practice and our projects towards our long-term goals.
In the end, even with the slow rate of our progress, our belief in the 2030 Commitment is unwavering.
Where do we go from here? To build on our existing protocol, we hope to tap into the potential of the DDx for operational carbon accounting. As a firm we push extremely hard for electrification wherever possible, and that strategy will bring its own carbon benefits as the grid gets cleaner over the long term. However, to date not all of our projects have reported fuel mix (which is used to calculate operational carbon emissions), particularly in the early phases of design. Similarly, while all of our projects submitted embodied carbon data, most of that data came from simple calculators and not from detailed whole building life cycle analysis. We also are not yet using the measured data tracking portion of the DDx and systematically mining the lessons learned between how we think projects will perform and how they actually perform.
Outside of the 2030 Commitment, we are looking to take the same process and portfolio-wide thinking to expand the metrics we are tracking, inspired by the AIA Framework for Design Excellence, the AIA (Committee on the Environment) Top Ten Awards, and the A+D Materials Pledge. Check back for next year’s review, where we will share what we learned and what we are trying, in the hopes of participating in a larger dialogue about how we, as a profession, can move forward together.
* A shout-out here to BNIM, EDR, LPA Design Studios, Mahlum, and Payette, who unsurprisingly have led the way in data transparency.
** Why five years and not the full six? Truthfully, the first year didn’t include our entire portfolio and our data quality was spotty as we were still learning what was real and what wasn’t.
