With just six years to go, signatories to the AIA 2030 Commitment are looking at their track records and feeling stuck. If you're one of them, you're not alone. At VMDO, we believe the only way for our industry to meet our carbon targets is to share what's working and what's not.
That's why, in keeping with the Way of Absolute Candor, VMDO is once again publishing detailed information on our 2030 Commitment portfolio submission and what we are learning from it. Our goal is to encourage other firms to share detailed metrics on both their portfolios and their projects and to provide a resource for others to learn from.
As was true last year, this is a long piece with lots of detail. Don’t have time to go through it all? Here are the key takeaways:
- Accountability is success. Data transparency is the only way we are going to learn from each other, and it is the best way to hold ourselves accountable. We should all be publishing our data whenever possible.
- Carbon is king. The move from energy use (kBTU) to emissions (kgCO2e) is a game-changer. It’s time we all start thinking about our work in terms of emissions, not energy bills.
- We all get an A for effort. Not every project is going to hit the 2030 target; it does not mean we should not try. Missing the target on a project is not necessarily a failure.
- If you commit, decarbonization will come. Signing on to the 2030 Commitment has revolutionized how VMDO practices. If you have not signed on, you should. At VMDO, the Commitment gave the sustainability team the leverage to change how we work and created a common language for discussing project performance/success.
This post is broken down into four parts:
- Part 1: Firmwide 2030 Metrics
- Part 2: Metrics by Typology
- Part 3: Moving from Energy to Carbon
- Part 4: What’s Next?
PART 1: Firm-Wide 2030 Metrics
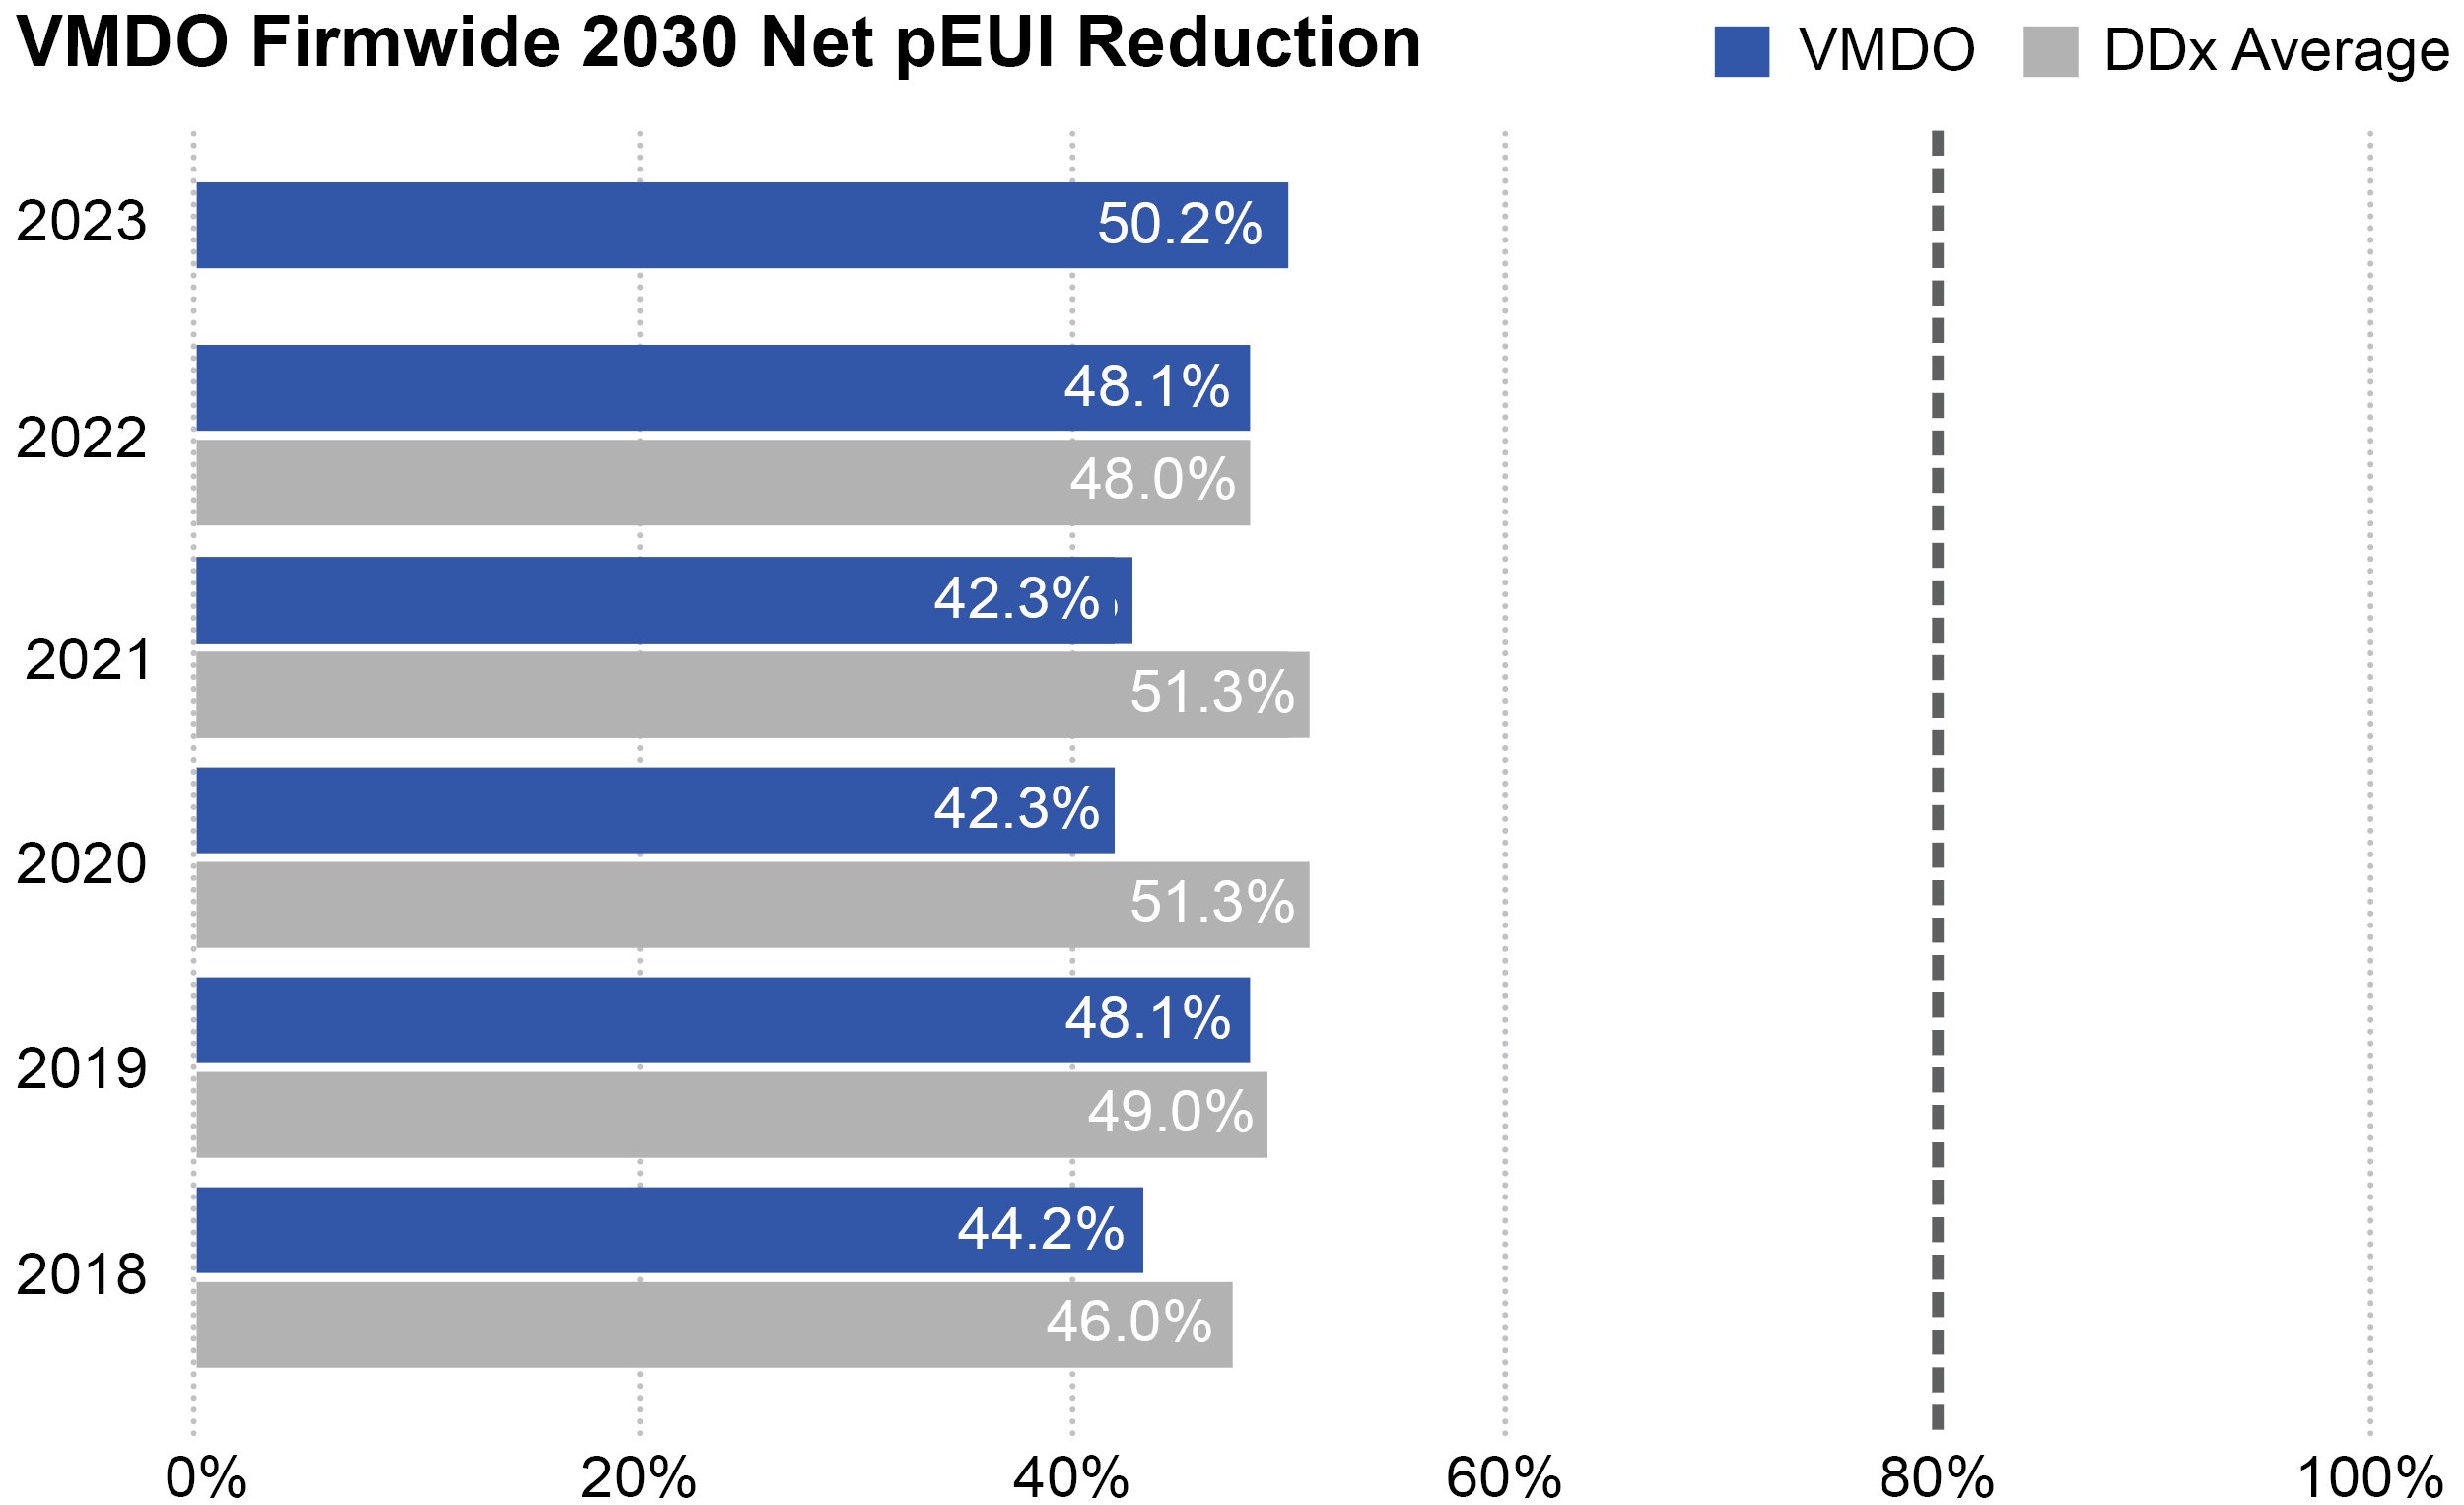
Our 2023 firmwide reduction was 50.2%, up slightly from previous years. Behind that number are some hard-won victories and some challenges/defeats that I’ll talk about in the next section. The relatively small change between our 2022 and 2023 portfolios is not surprising as we have several large projects under construction right now. Their projected energy use intensities (EUIs) will remain stable until they are complete.
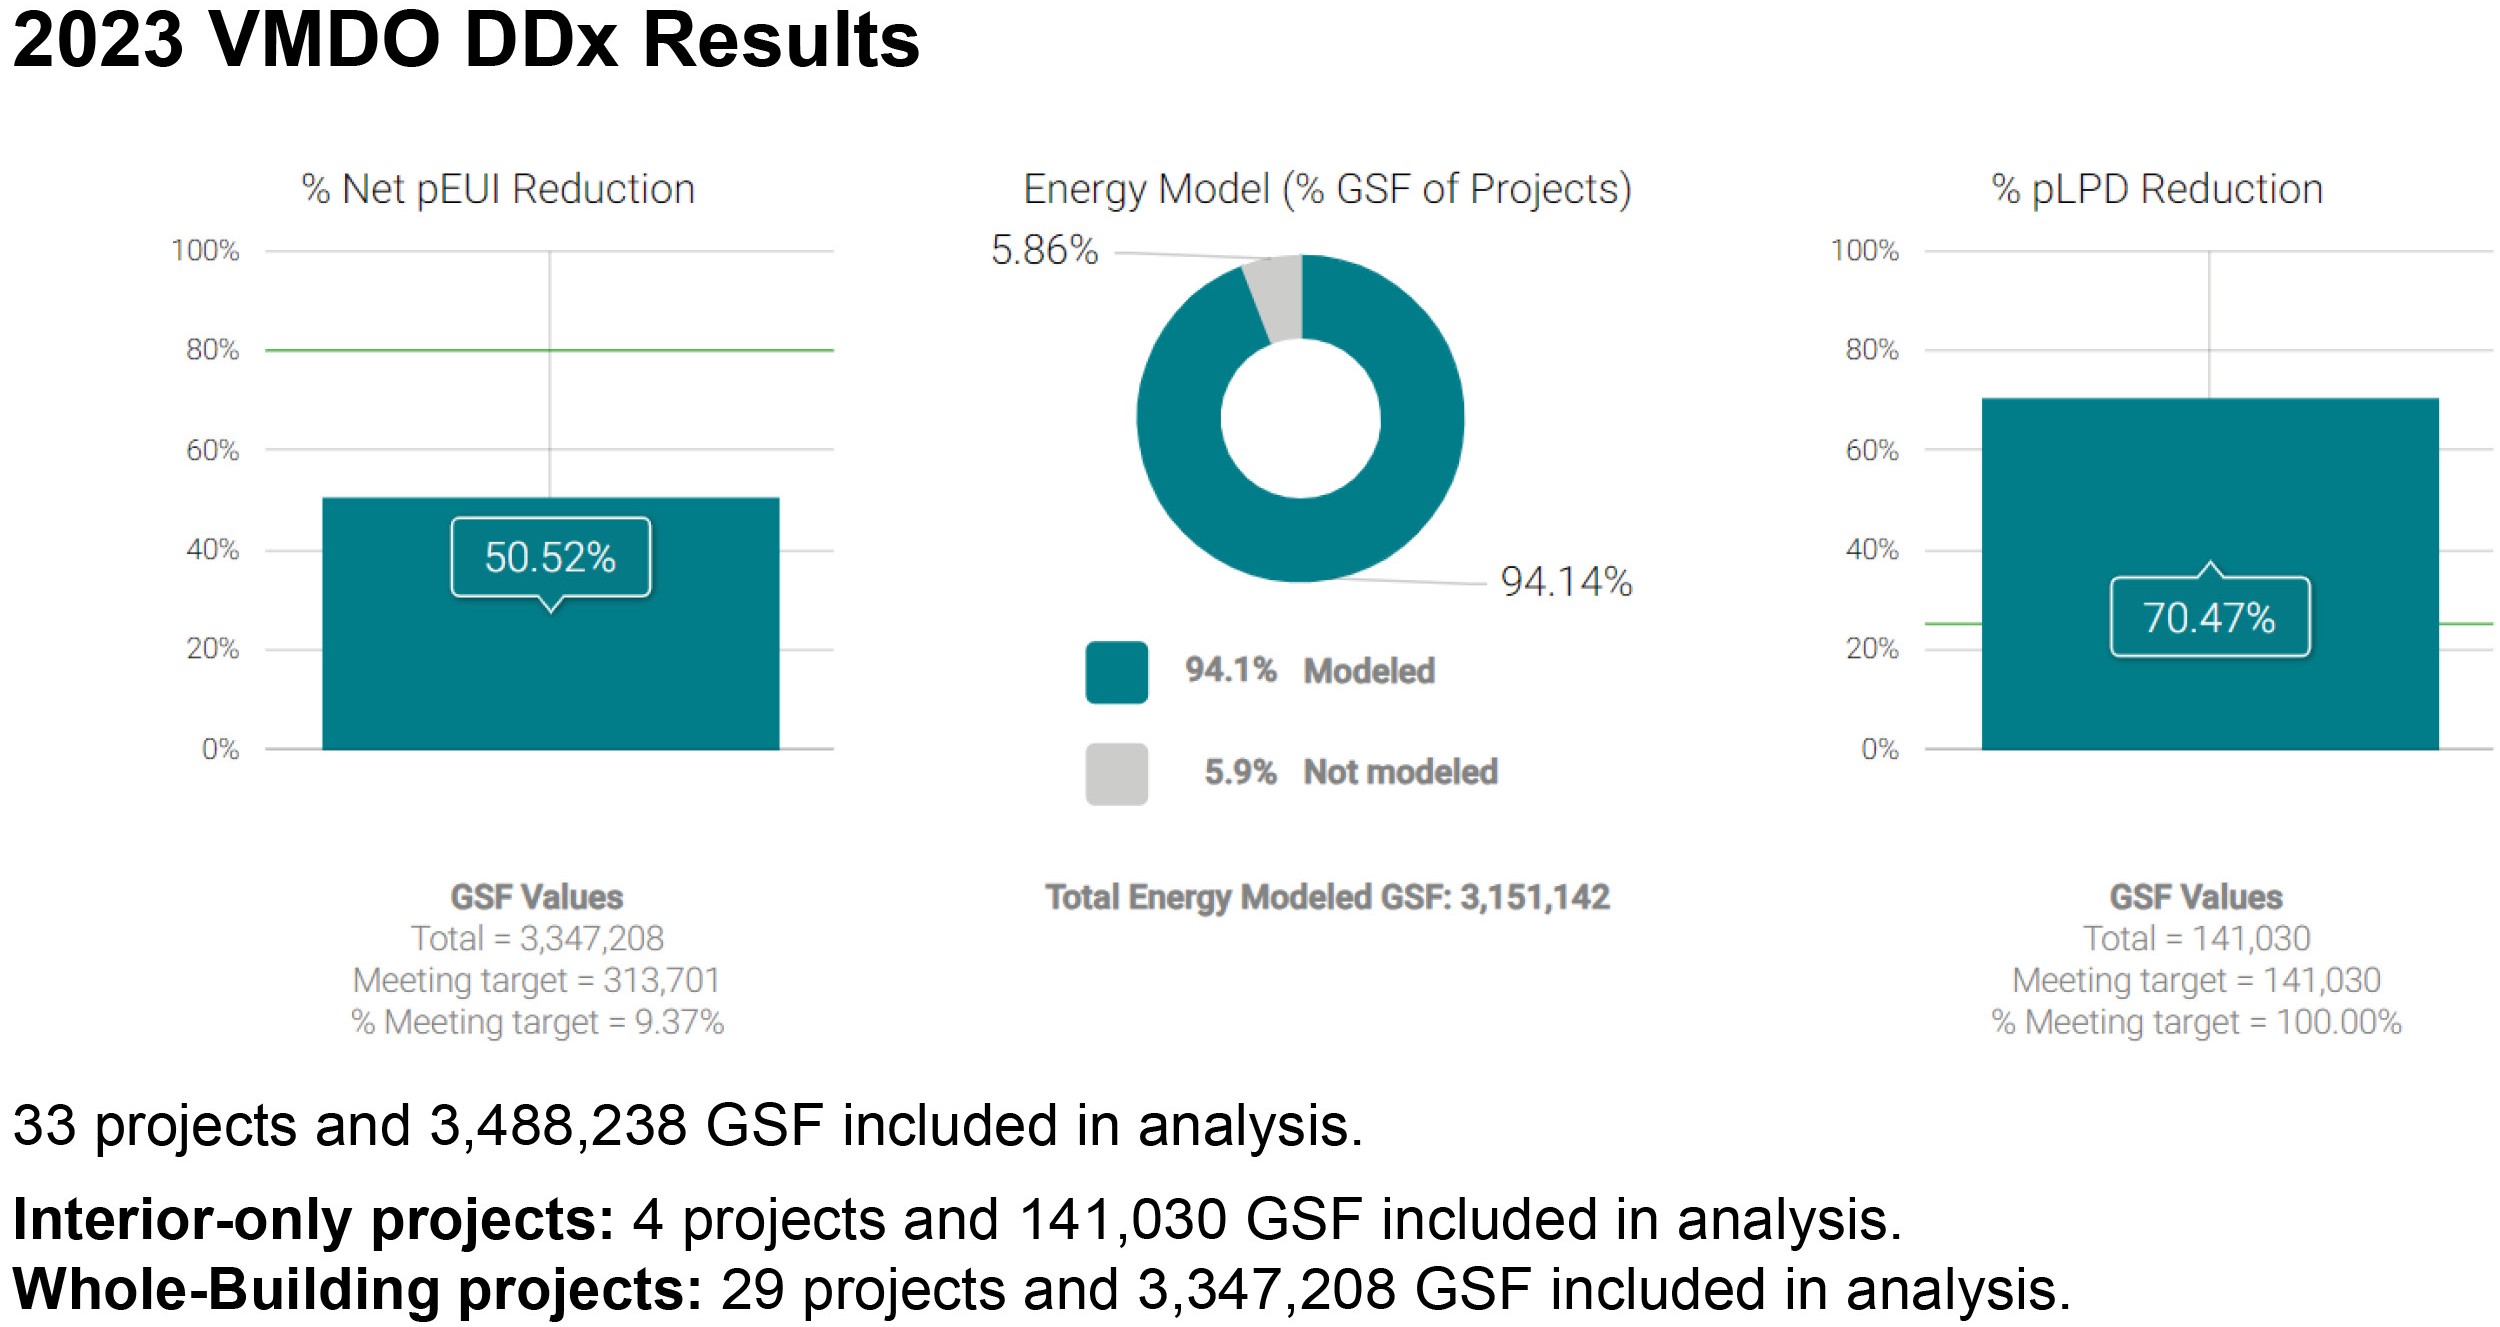
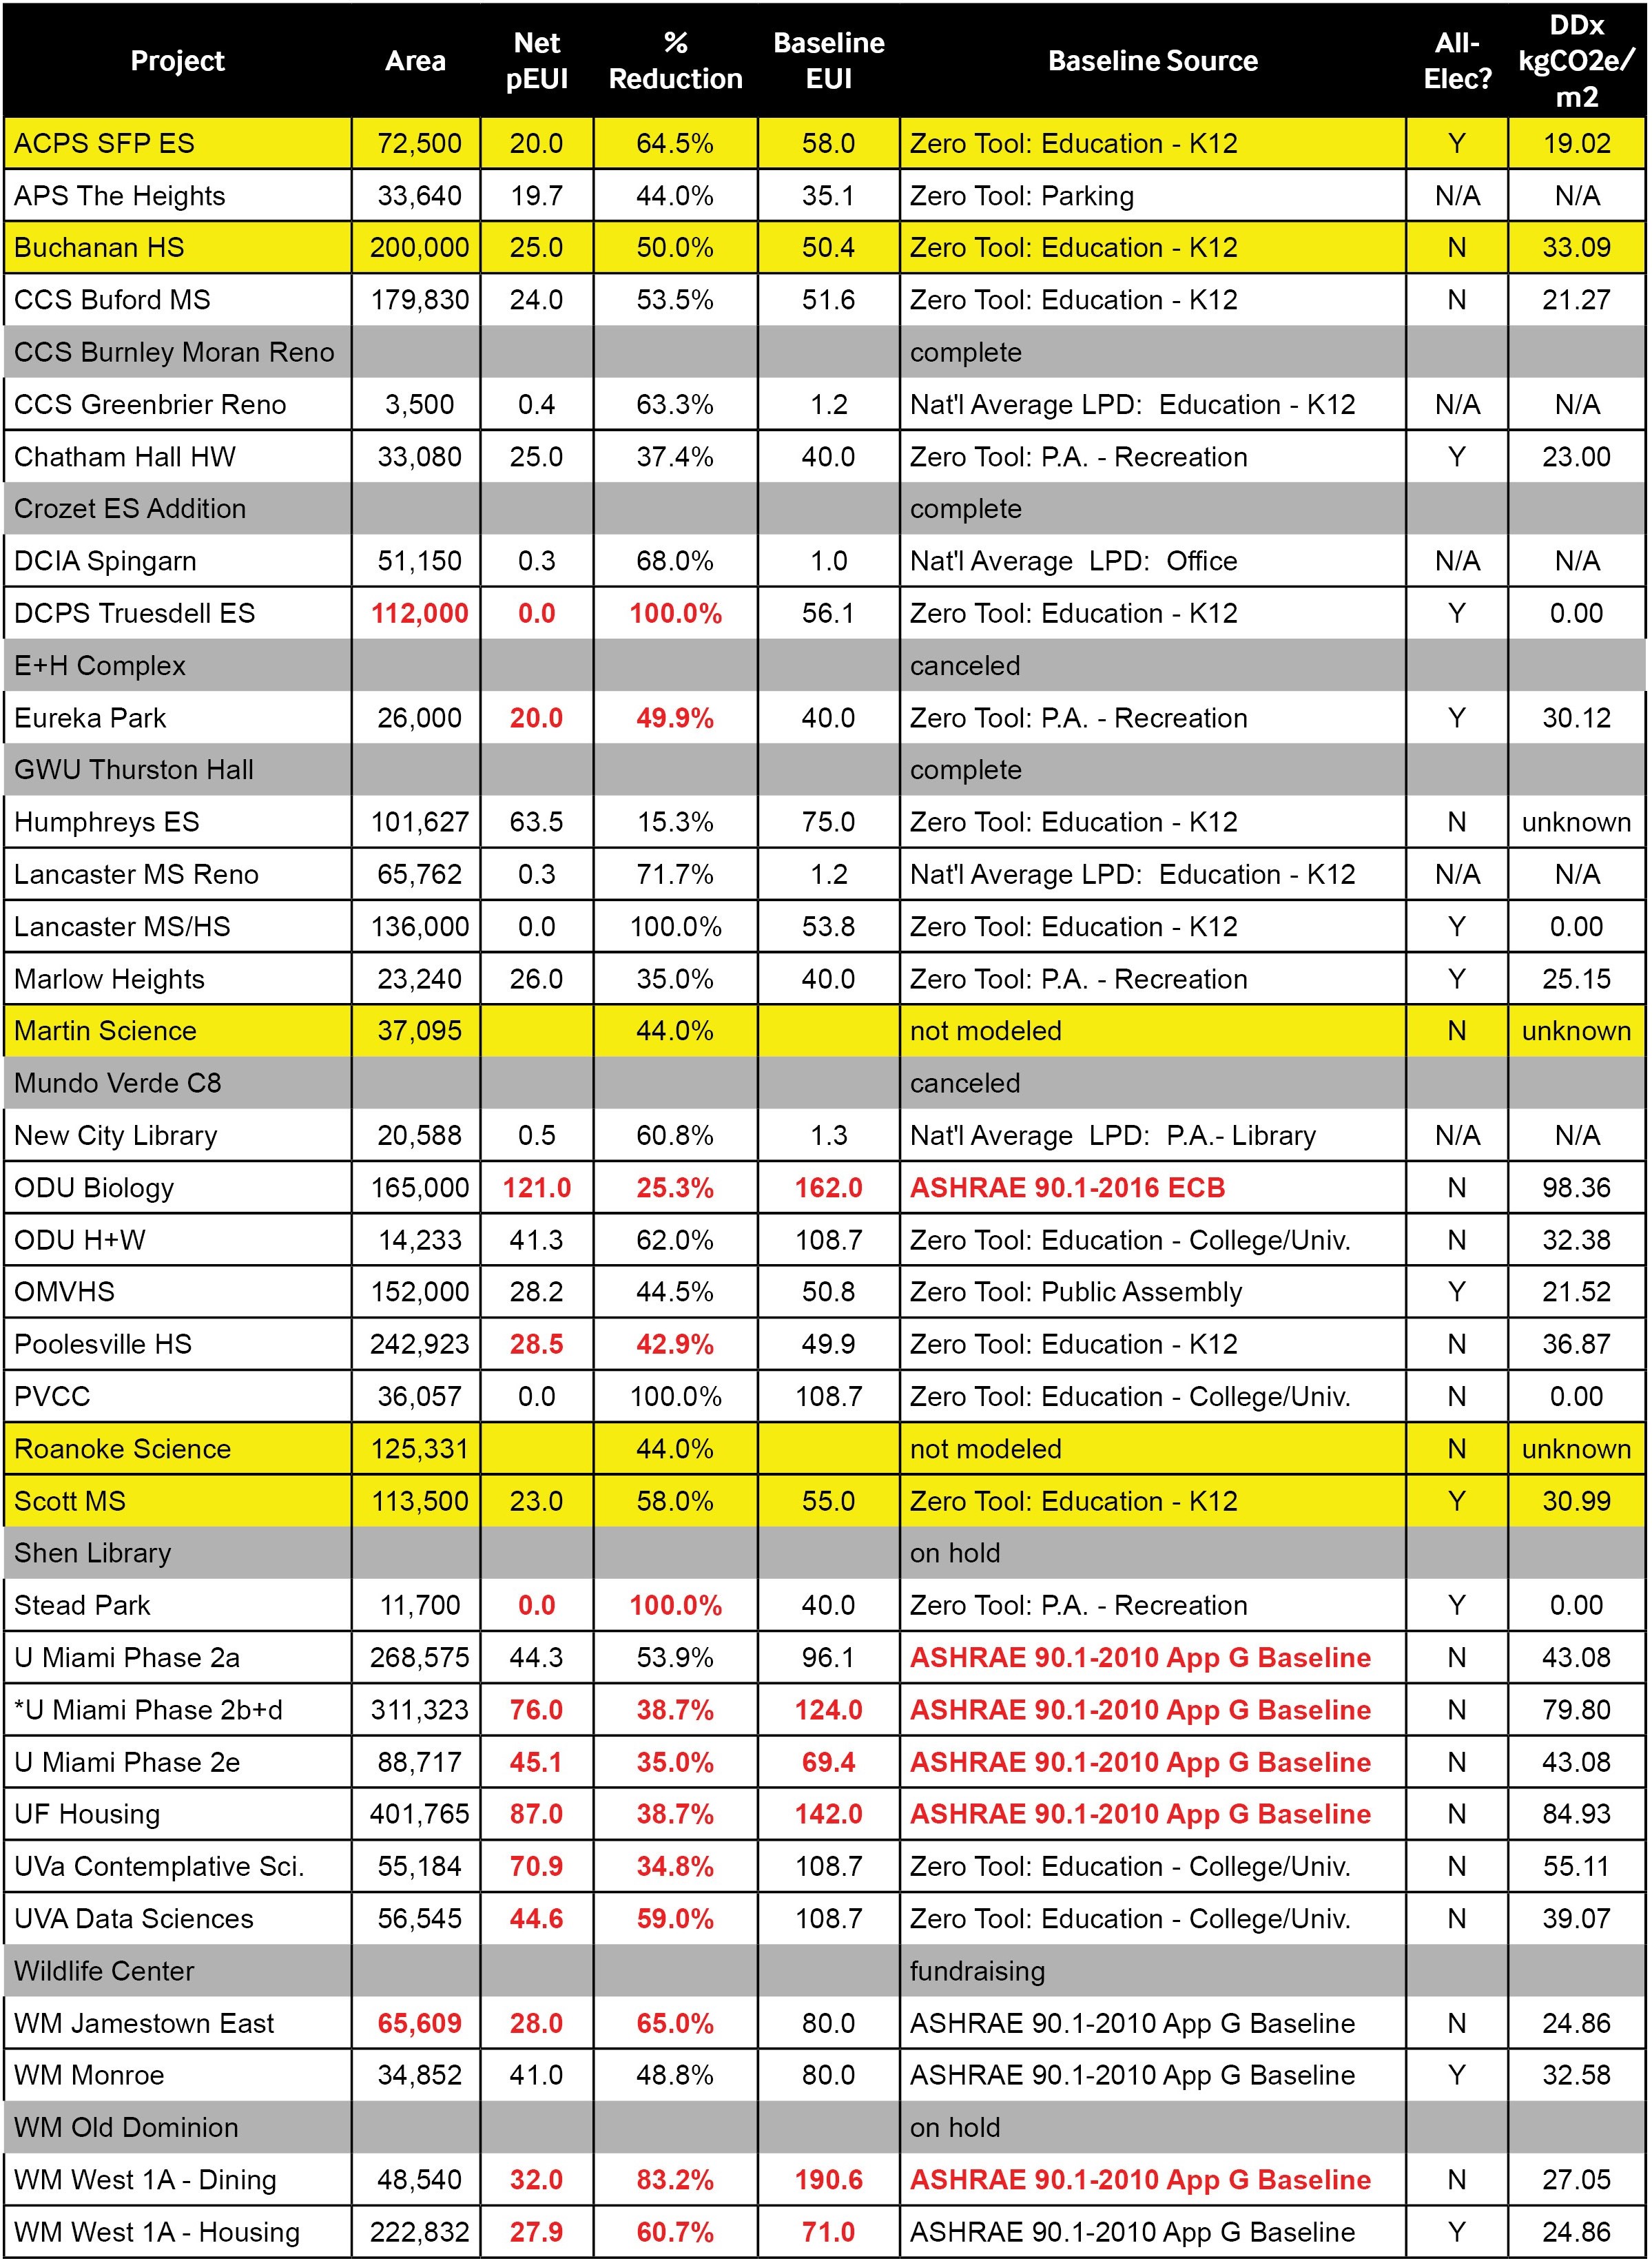
Here is a snapshot of our 2023 dashboard. Most of our projects have an energy model; those that do not are complex renovations where we are working directly with HVAC contractors. Almost all models are done by the design engineers, not VMDO. As you can see from the floor area numbers, VMDO does not do a lot of tenant improvement projects, so lighting power density (LPD) does not make much of an impact on our portfolio’s performance.
Part 2: Metrics by Typology
In addition to publicizing portfolio performance, it’s critical that we start sharing our detailed project data—that’s how we all get better at making progress on climate.
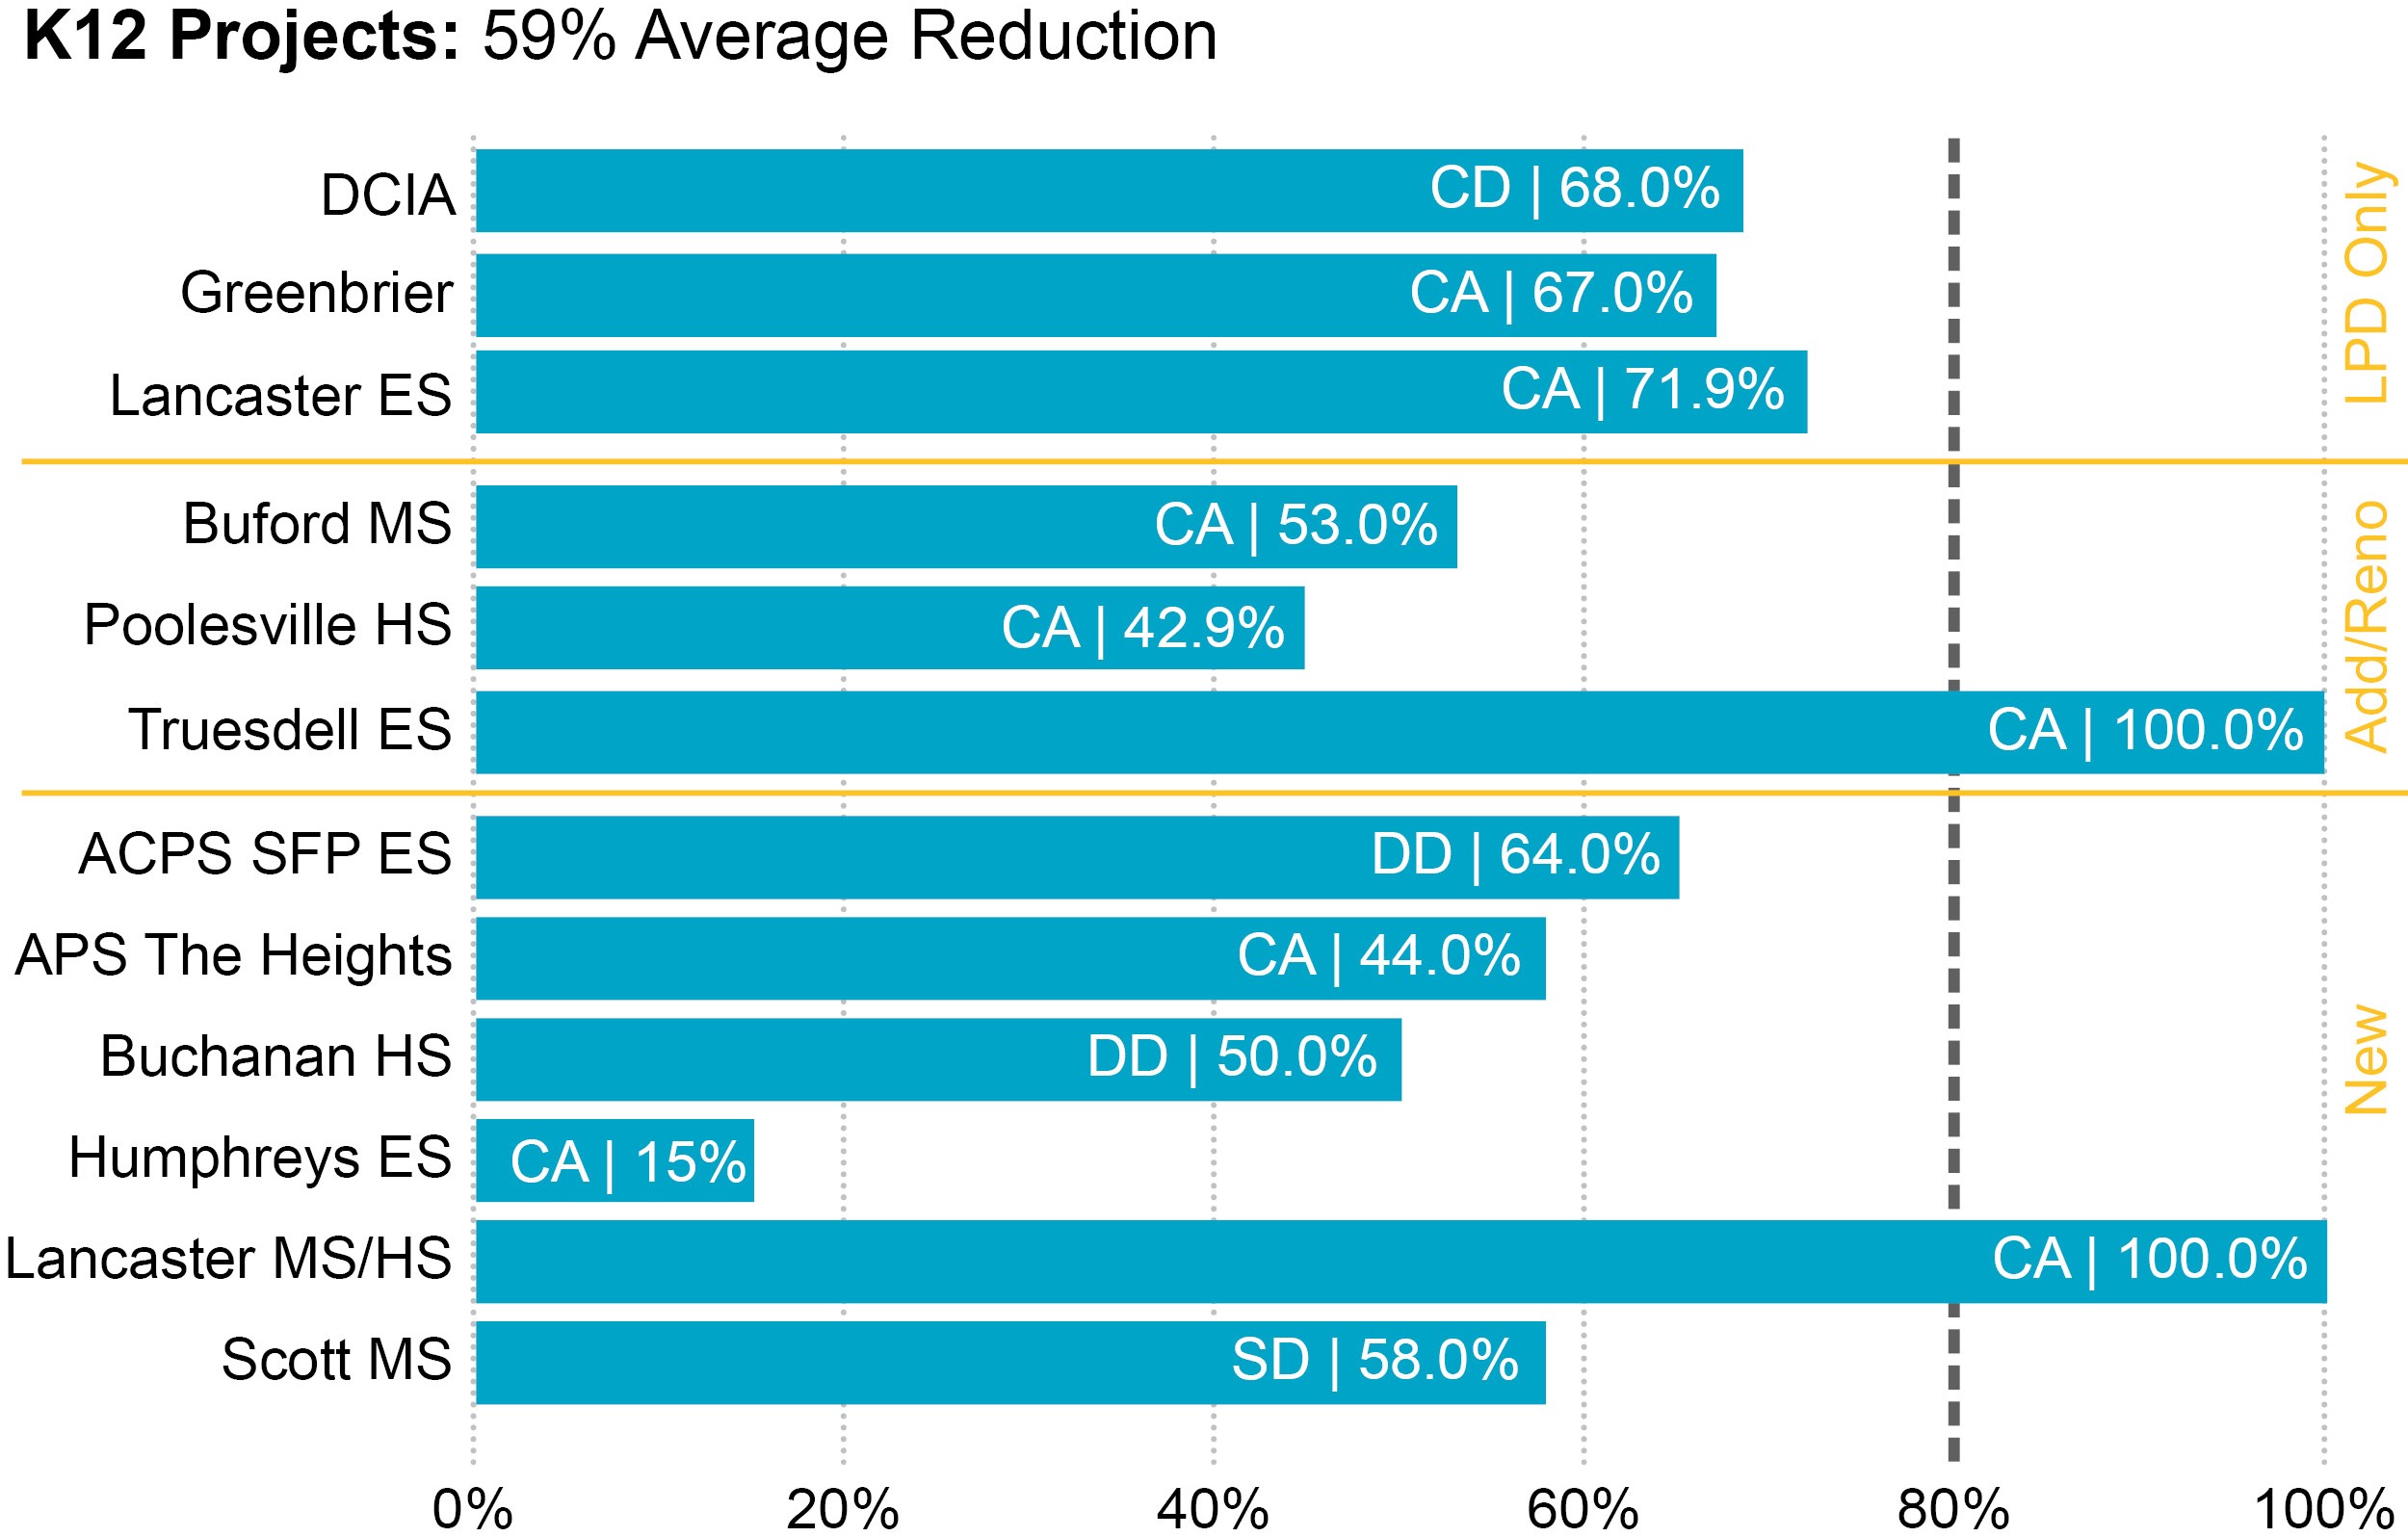
2023 VMDO K12 Projects
VMDO had a few large K12 projects hit the boards in 2023, and combined with projects completing in other typologies, the overall percentage of our portfolio that is K12 work grew from 26% in 2022 to 33% in 2023. This change in portfolio balance has effects on our firmwide numbers because, in general, our K12 work tends to have better energy performance and a greater likelihood of having renewables installed (at least that used to be the case until Dominion Power started acting up).
Highlights when comparing 2023 to 2022 include:
- Our K12 portfolio average reduction improved by 6%, from 53% in 2022 to 59% reduction in 2023.
- Projects that completed or paused in this typology include Crozet ES, Mundo Verde C8, Burnley-Moran ES
- New projects in this typology include Scott MS, Buchanan HS, ACPS SFP ES
Major changes to 2030 reporting for projects already in the DDx include:
- Truesdell ES made enough headway on its power purchase agreement (PPA) that we included renewable energy production in the calculations. This headway was a possibility in 2022, as zero energy performance is contractually required, but we took a conservative approach.
- Poolesville HS had an updated energy model that showed a slightly higher EUI, due more to refinements on the model than to changes in the design. It is a complex renovation/addition with a plethora of sustainability victories that aren’t reflected in its moderate EUI reductions.
As an aside, with the new AIA DDx (Design Data Exchange) Research Tab, you can now compare your firm’s projects to the DDx database, filtered by area, typology, country, location, climate zone, modeling tool, fuel sources and project phase. As an example:
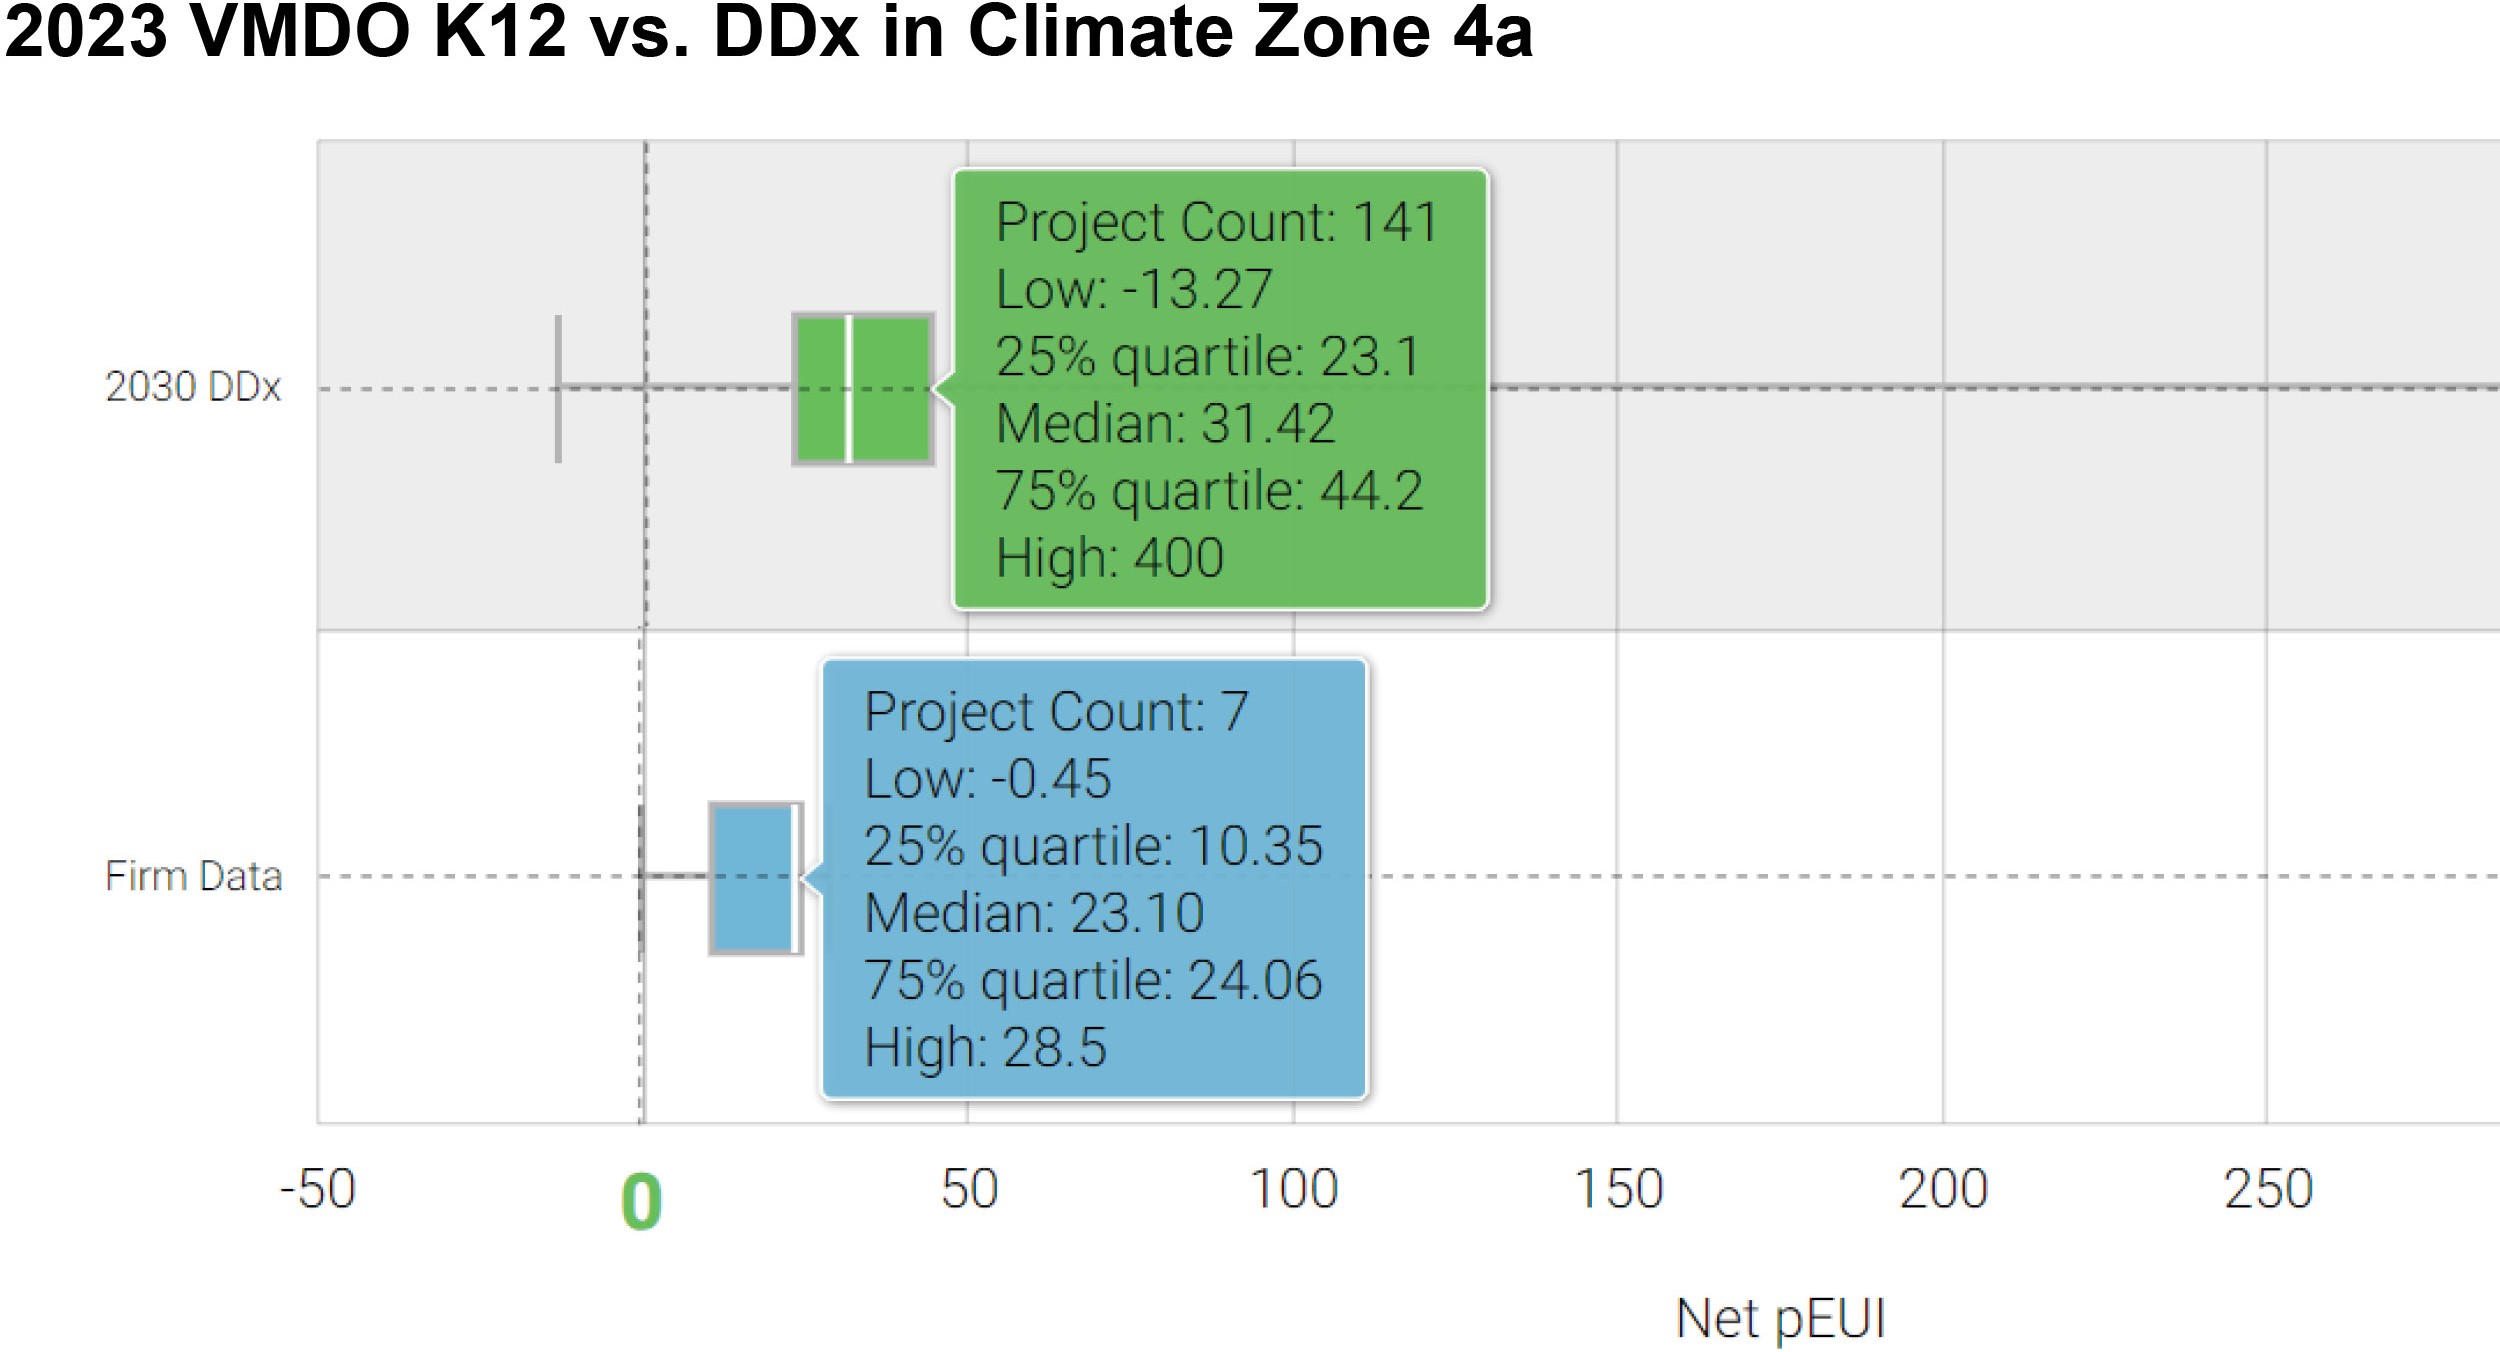
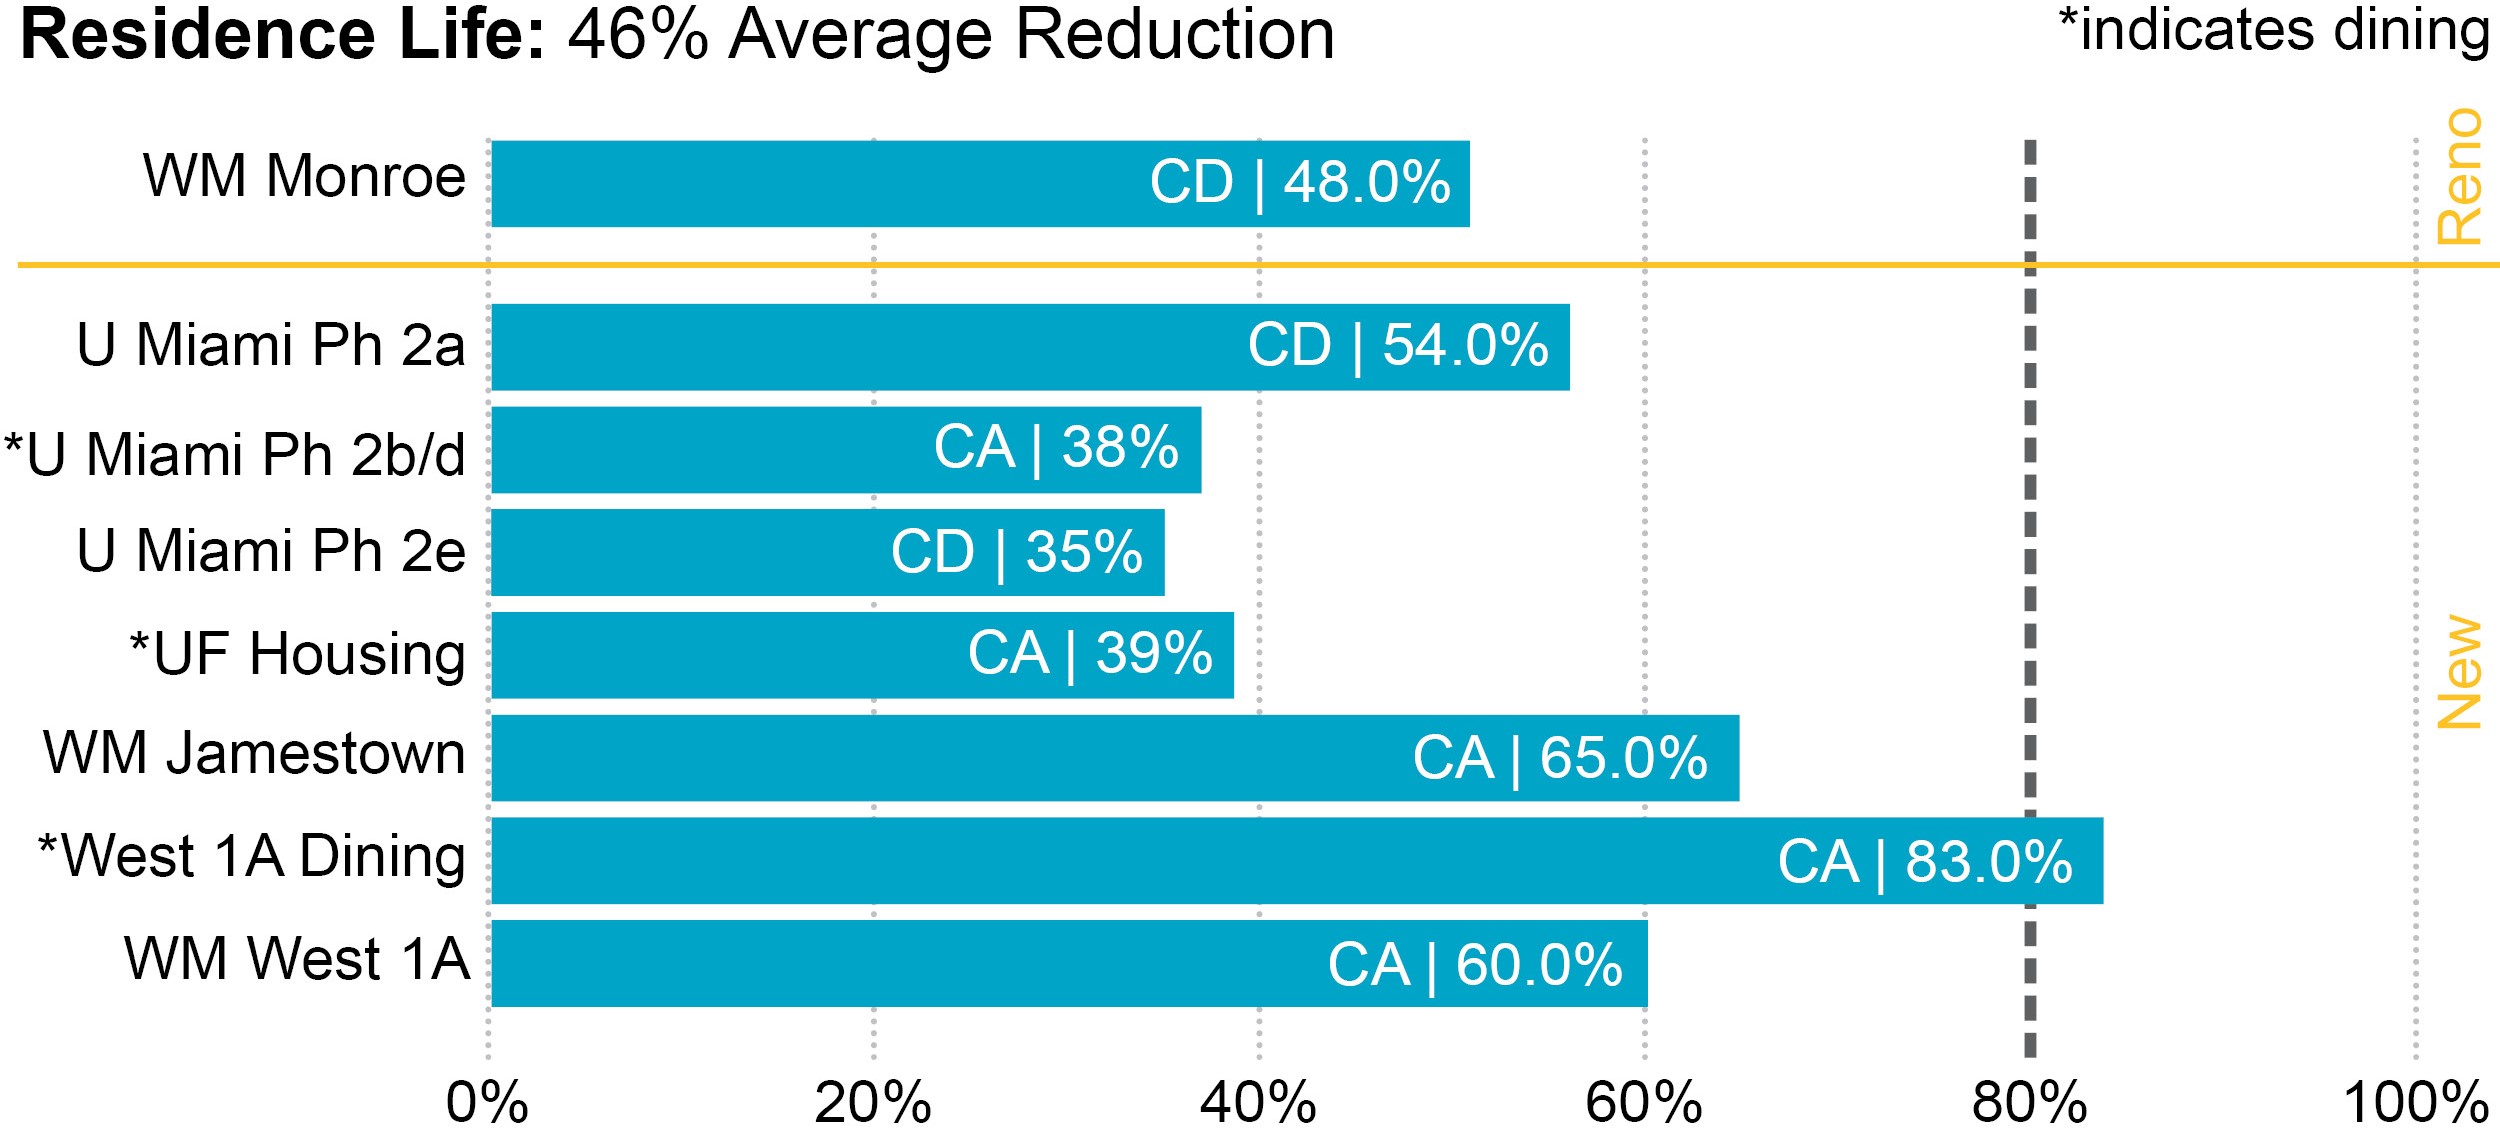
2023 Residence Life Projects
Residence Life has been focusing on delivering the large projects captured in 2022.
- Our Residence Life portfolio reduction improved by 4%, from 42% in 2022 to 46% reduction in 2023.
- Projects that completed or paused in this typology include WM Old Dominion and GWU Thurston.
- There were no new residence life projects in 2023.
Major changes to 2030 reporting for projects already in the DDx include:
- Value engineering and updated models at the University of Miami Phases 2b/d and 2e impacted both the projected EUI and the project baselines (since VMDO uses LEED baselines for residence life**), resulting in a lower percentage reduction.
This was offset by amazing strides on our projects at the College of William and Mary, which are showing some of the lowest EUIs we have seen on our residence life projects. A major win on those projects has been incorporating ground-source geothermal, which is currently being installed.
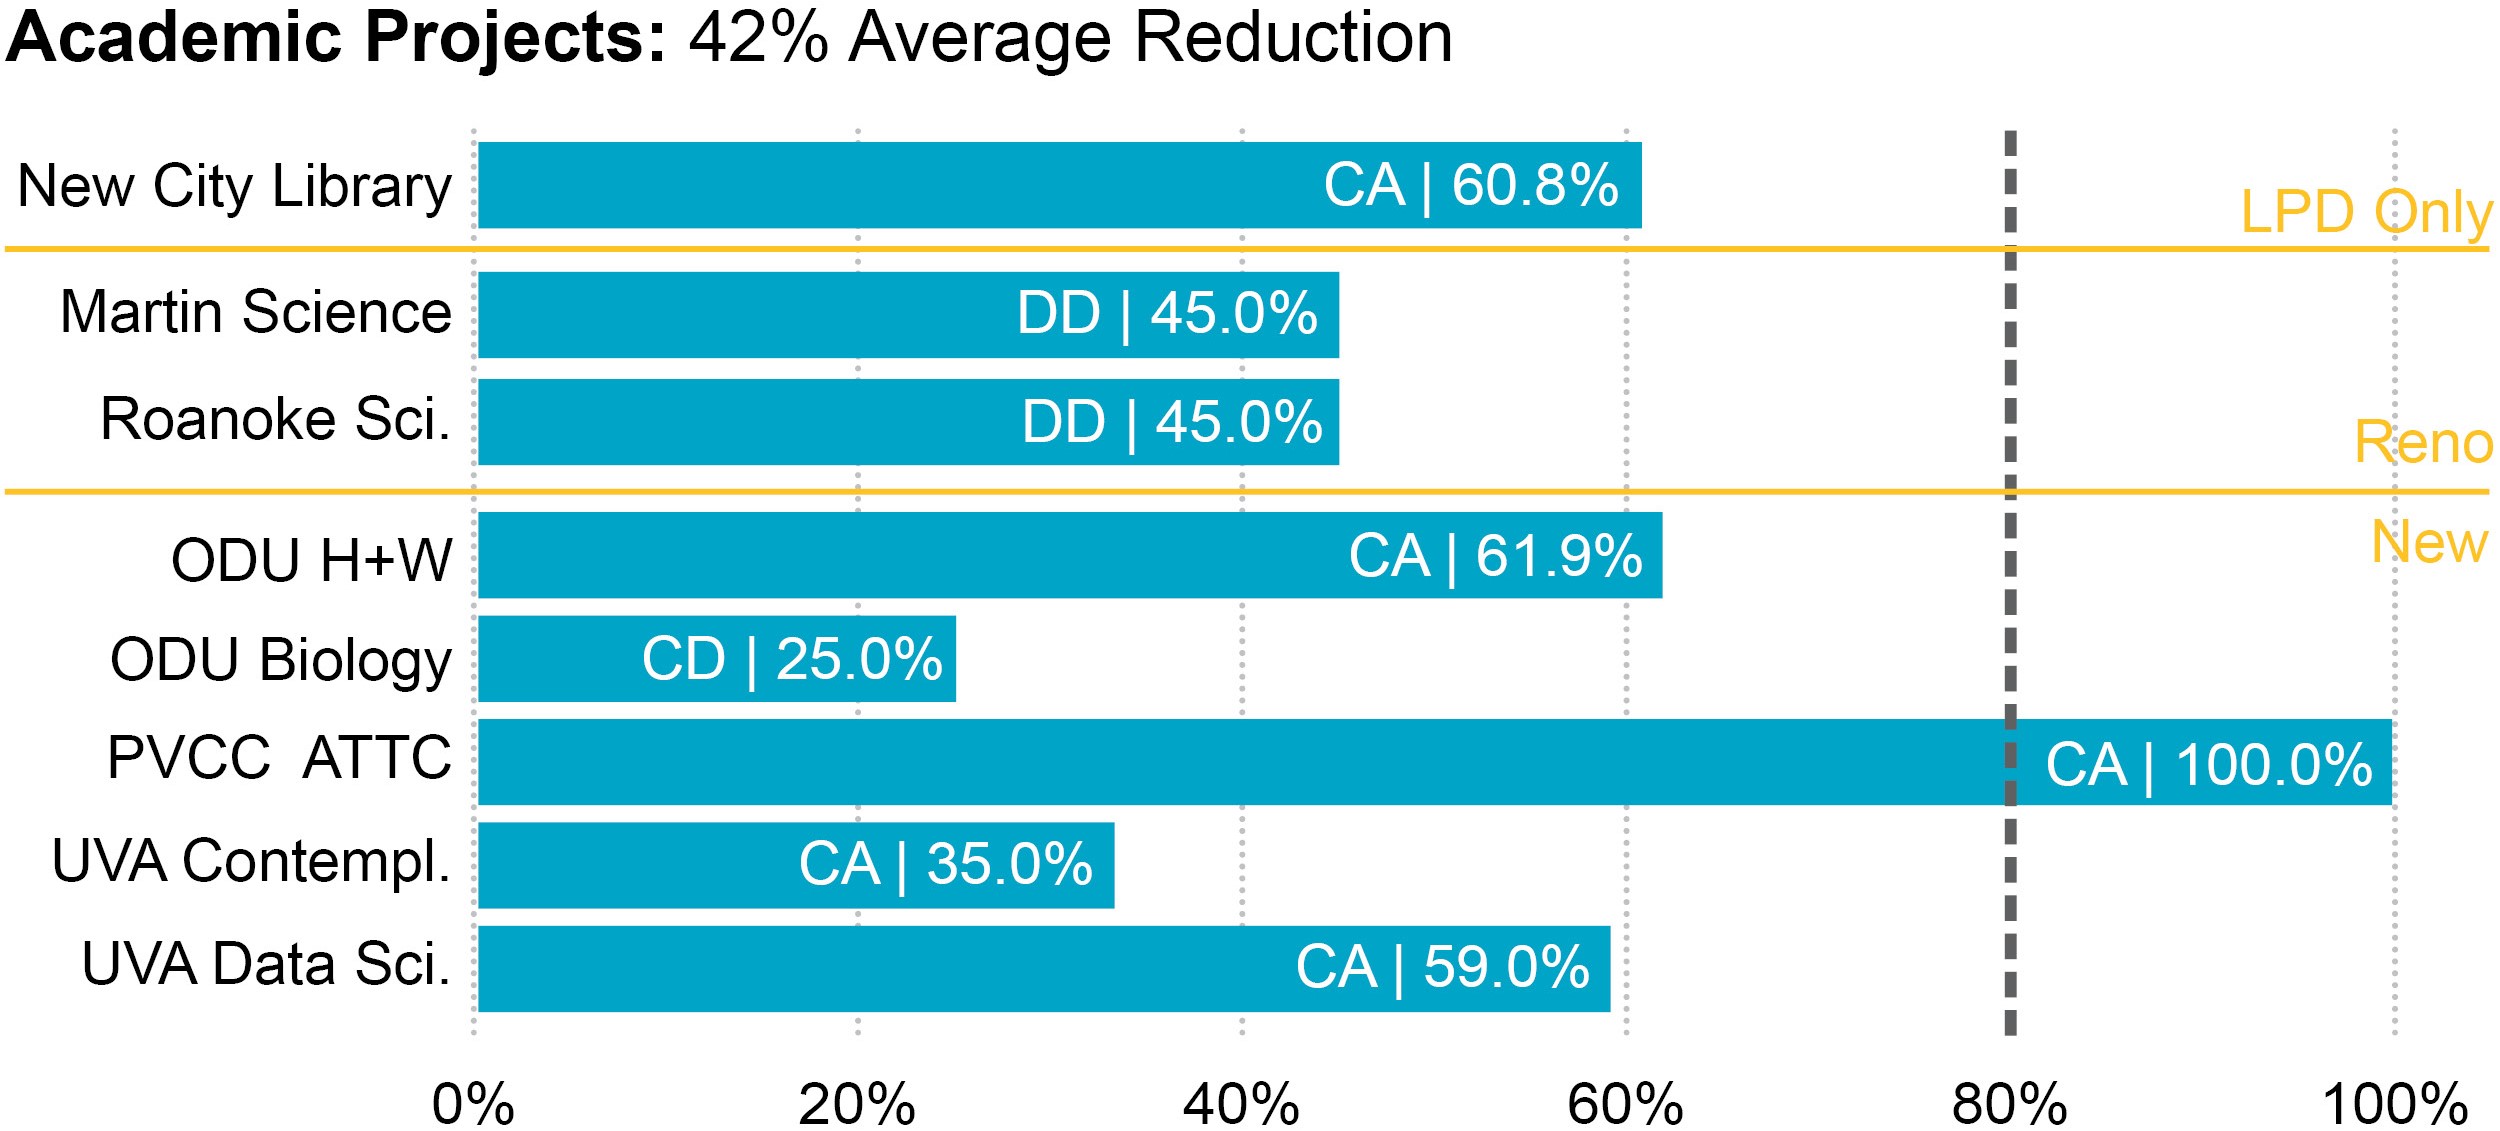
2023 Academic Projects
This category contains a range of programs—from science labs to maker spaces, offices to classrooms, libraries to wellness centers—and has historically had the greatest variability in performance based on the programmatic mix. This year, its performance is dominated by science buildings.
- Our Academic portfolio reduction worsened by 11%, from 53% in 2022 to 42% in 2023.
- Shenandoah Library was the only project that completed/paused.
- New projects in this typology include Martin Science and Roanoke Science. These projects will not have energy models, as we are working directly with HVAC contractors and the limits of disturbance are complex.
Major changes to 2030 reporting for projects already in the DDx include:
- ODU Bio has an updated energy model/LEED baseline, which dropped the project’s EUI reduction to 25% in 2023 from 53% in 2022, significantly affecting both the typology’s performance and the firm’s portfolio performance for the coming years. This is a project for which we are the architect of record (AOR), not design architect. The AOR role is a difficult one in terms of performance—we can advise our partner firms, but by the time we are officially in charge of the documents, we can only make tweaks to detailing and improve specifications. The design and systems are fixed.
Energy models on the UVA projects had slight modifications as they finalized their LEED documentation based on reviewer comments.
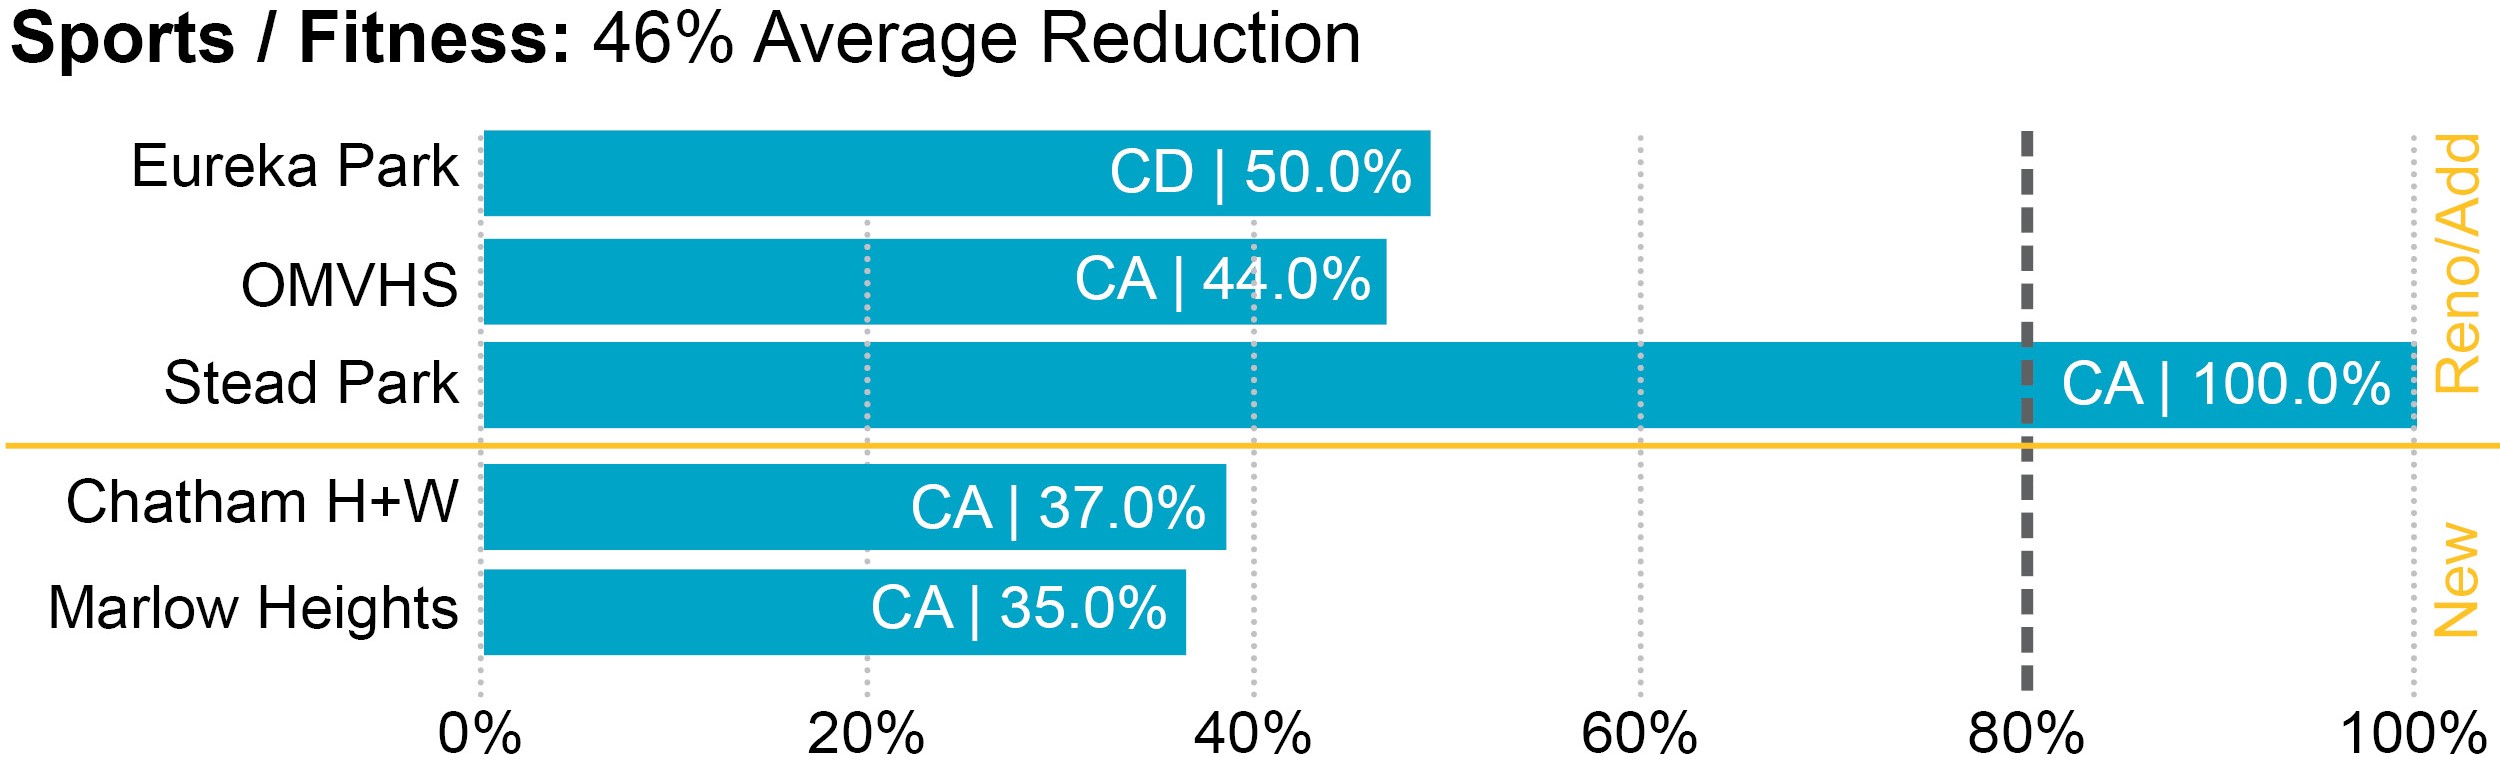
2023 Sports/Fitness Projects
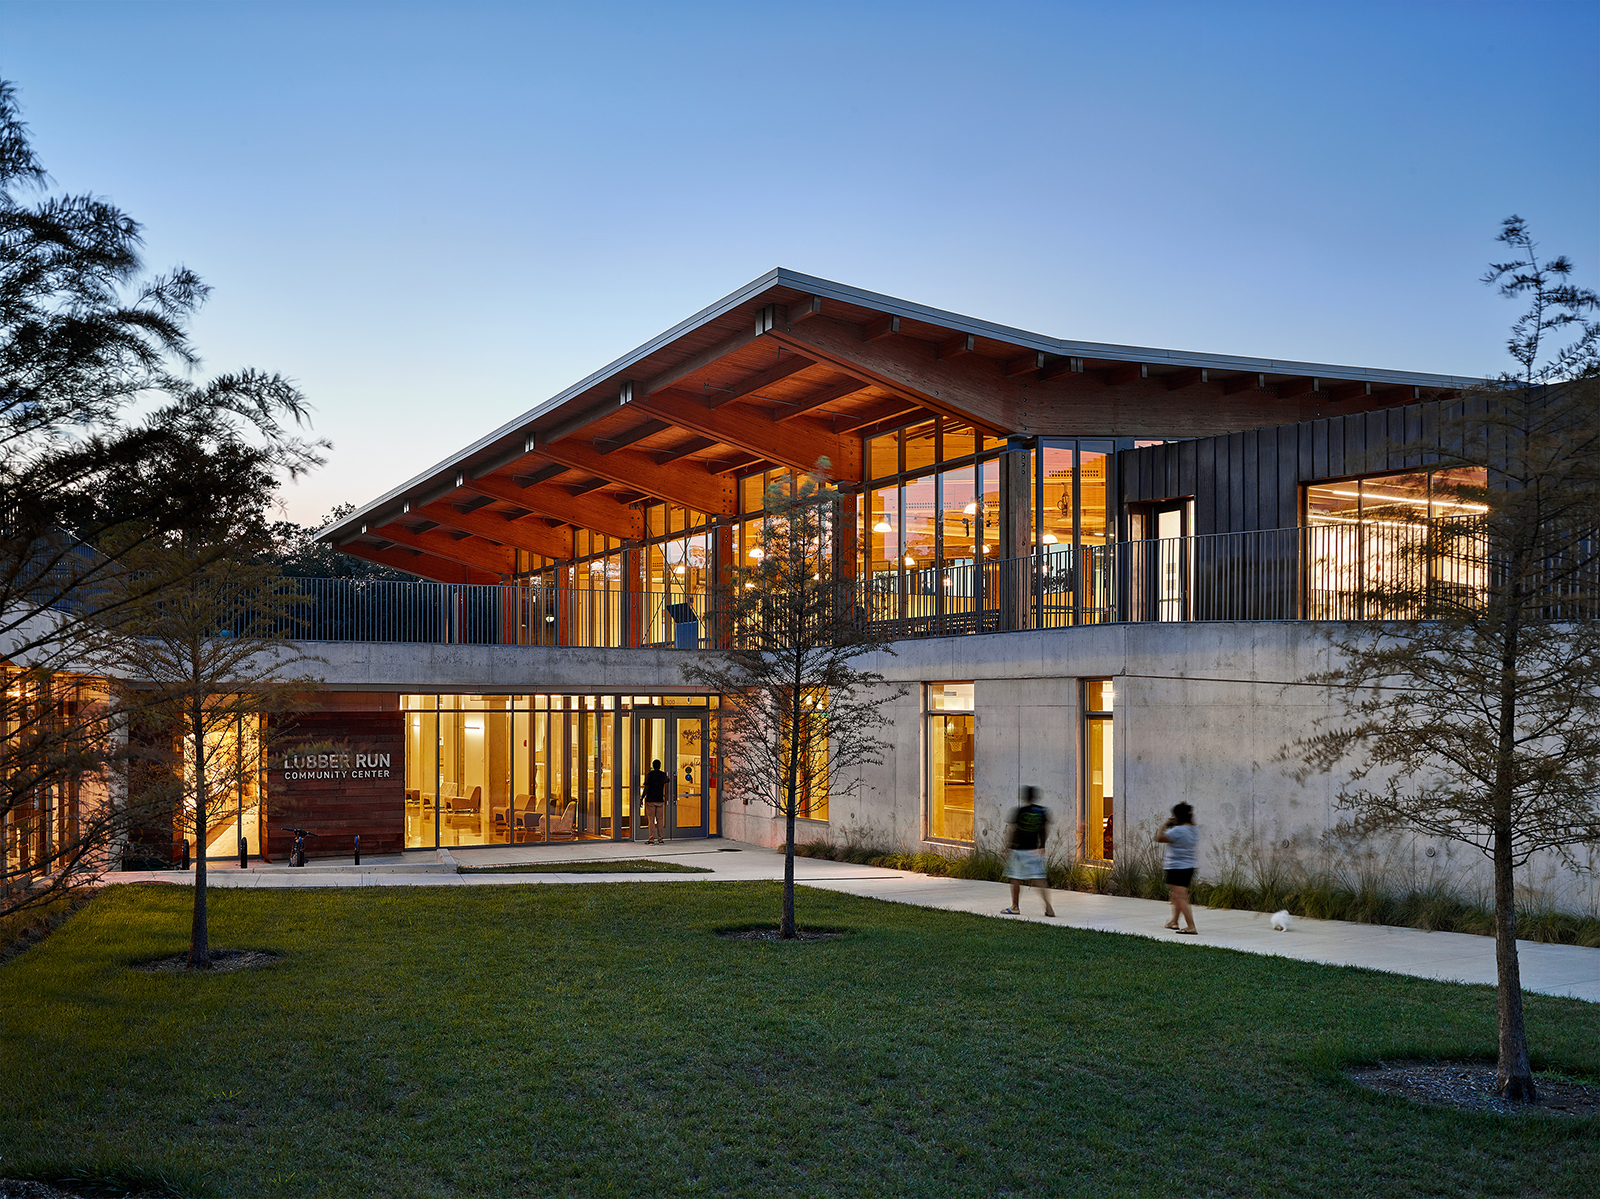
Sports/Fitness includes community centers and athletic facilities.
- Our Sports/fitness portfolio reduction improved by 3%, from 43% reduction in 2022 to 46% reduction in 2023.
- E+H Complex was the only project that completed/paused.
- There were no new projects added in this typology in 2023.
Major changes to 2030 reporting for projects already in the DDx include:
- Progress on the Stead Park PPA made us include the full PV array in the DDx this year.
Many of the projects in this category had minor adjustments to their energy models in 2023.And in the interest of full transparency, here are the specifics for each project, with changes to last year’s data highlighted in red (energy model updates) and gray (on hold or completed). New projects are highlighted in yellow. The changes to the baseline source for some of our residence life projects are because a LEED consultant read our website and called out that we had the wrong version of 90.1 listed (thanks, Christopher!). Those pages/references have now been corrected. This year, we added to the chart whether a project is all-electric and its operational kgCO2e/m2 as calculated by the DDx.
Part 3: Moving from Energy to Carbon
When I sent last year’s piece to reviewers before it was published, Nadav Malin made a comment that really challenged me: “we now know that zero energy is the wrong goal: reasonable energy efficiency, electrification, grid interactivity, and embodied carbon is where we should be focusing.” I’m not ashamed to admit that I spent a few months really wrestling with this comment. “What about Virginia’s dirty grid? Wait, are we moving the goal posts again? Electrification and carbon don’t show up in the DDx.” And yet deep down I knew he was right: focusing on net-zero energy is an important step, but net-zero energy never was the true goal of the 2030 Commitment—it is about zero carbon, and those two things are not the same.
Thankfully, the AIA 2030 Commitment Working Group was already ahead of this and launched updates to the DDx at the end of 2023 that incorporate eGrid emissions factors. Our focus this year for 2030 reporting was to expand our operational emissions reporting and embodied carbon reporting. The two tools we used were the DDx and EHDD’s EPIC tool.
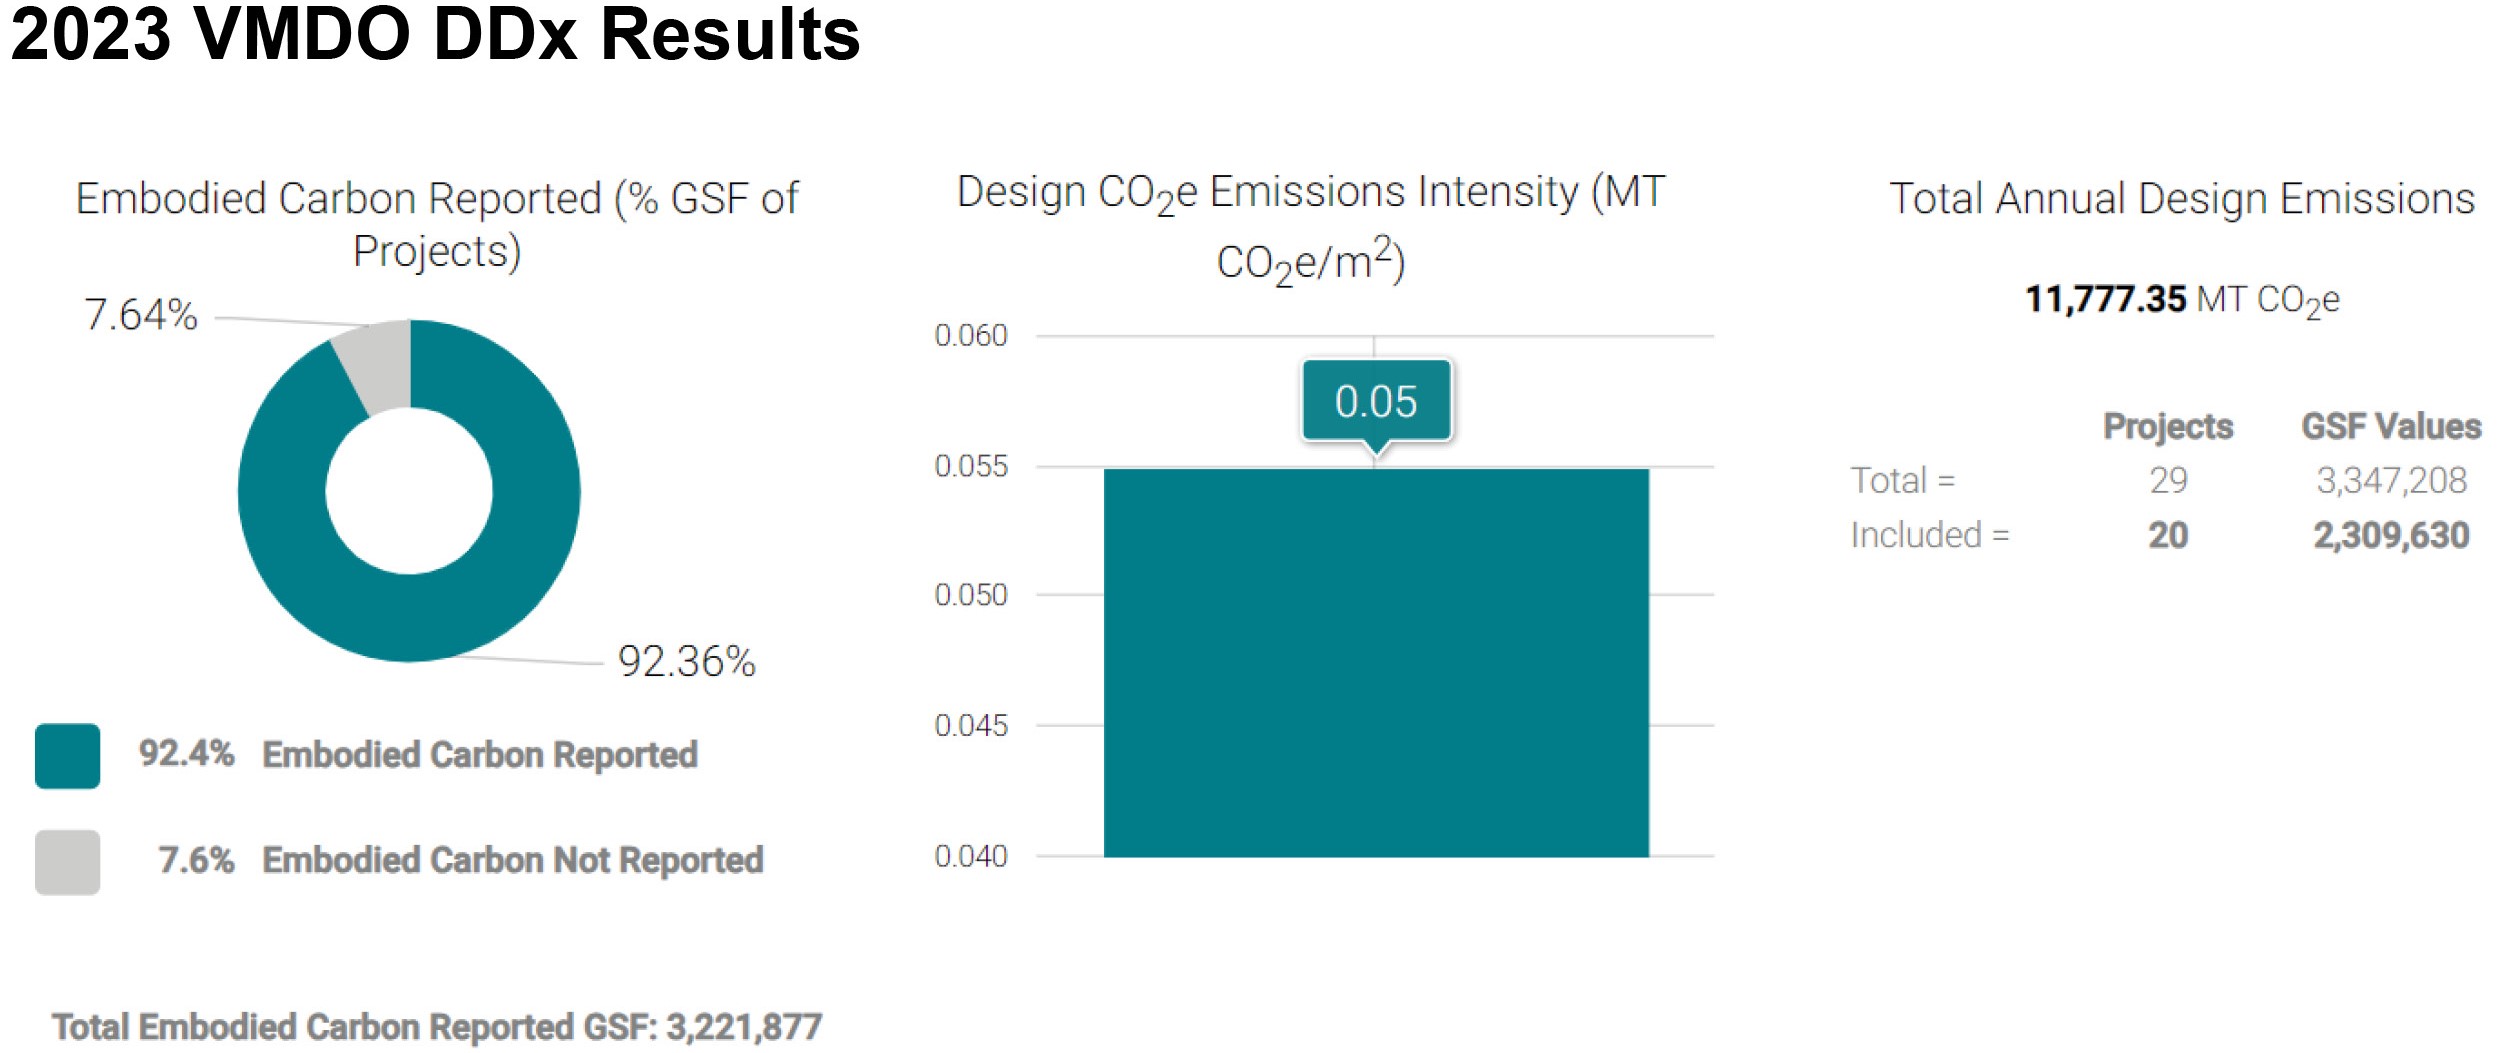
Our firmwide results are below: 92% of our projects have simple embodied carbon modeling, and 70% of our portfolio’s gross square footage has fuel mix reported in addition to a predicted EUI. (I’ll admit I’m struggling to make that center graphic/statistic meaningful; I have faith it’s going to evolve into something great.)
Operational Carbon
Here are the things we learned from inputting fuel mixes into the DDx this year:
- Inputting by fuel type is a great way of double-checking your predicted EUI. A couple of projects had inconsistencies between the pEUI and the provided fuel breakdowns, which highlighted outdated information and triggered conversations that gave us a deeper understanding of the projects.
- Location really matters given the fuel mix/emissions factors of different electricity grids. As an example, Scott MS in Kentucky had twice the emissions as ACPS SFP ES in Virginia, despite both projects being the same typology, similar size, same MEP approach, and roughly the same EUI. Same goes for projects in Florida versus Virginia.
As an aside, the EPIC tool also makes the case for electrification when looking at operational carbon over time. For buildings that use fossil fuels, the c.scale model assumes a certain amount of methane leakage which really adds up over time.
Upfront / Embodied Carbon
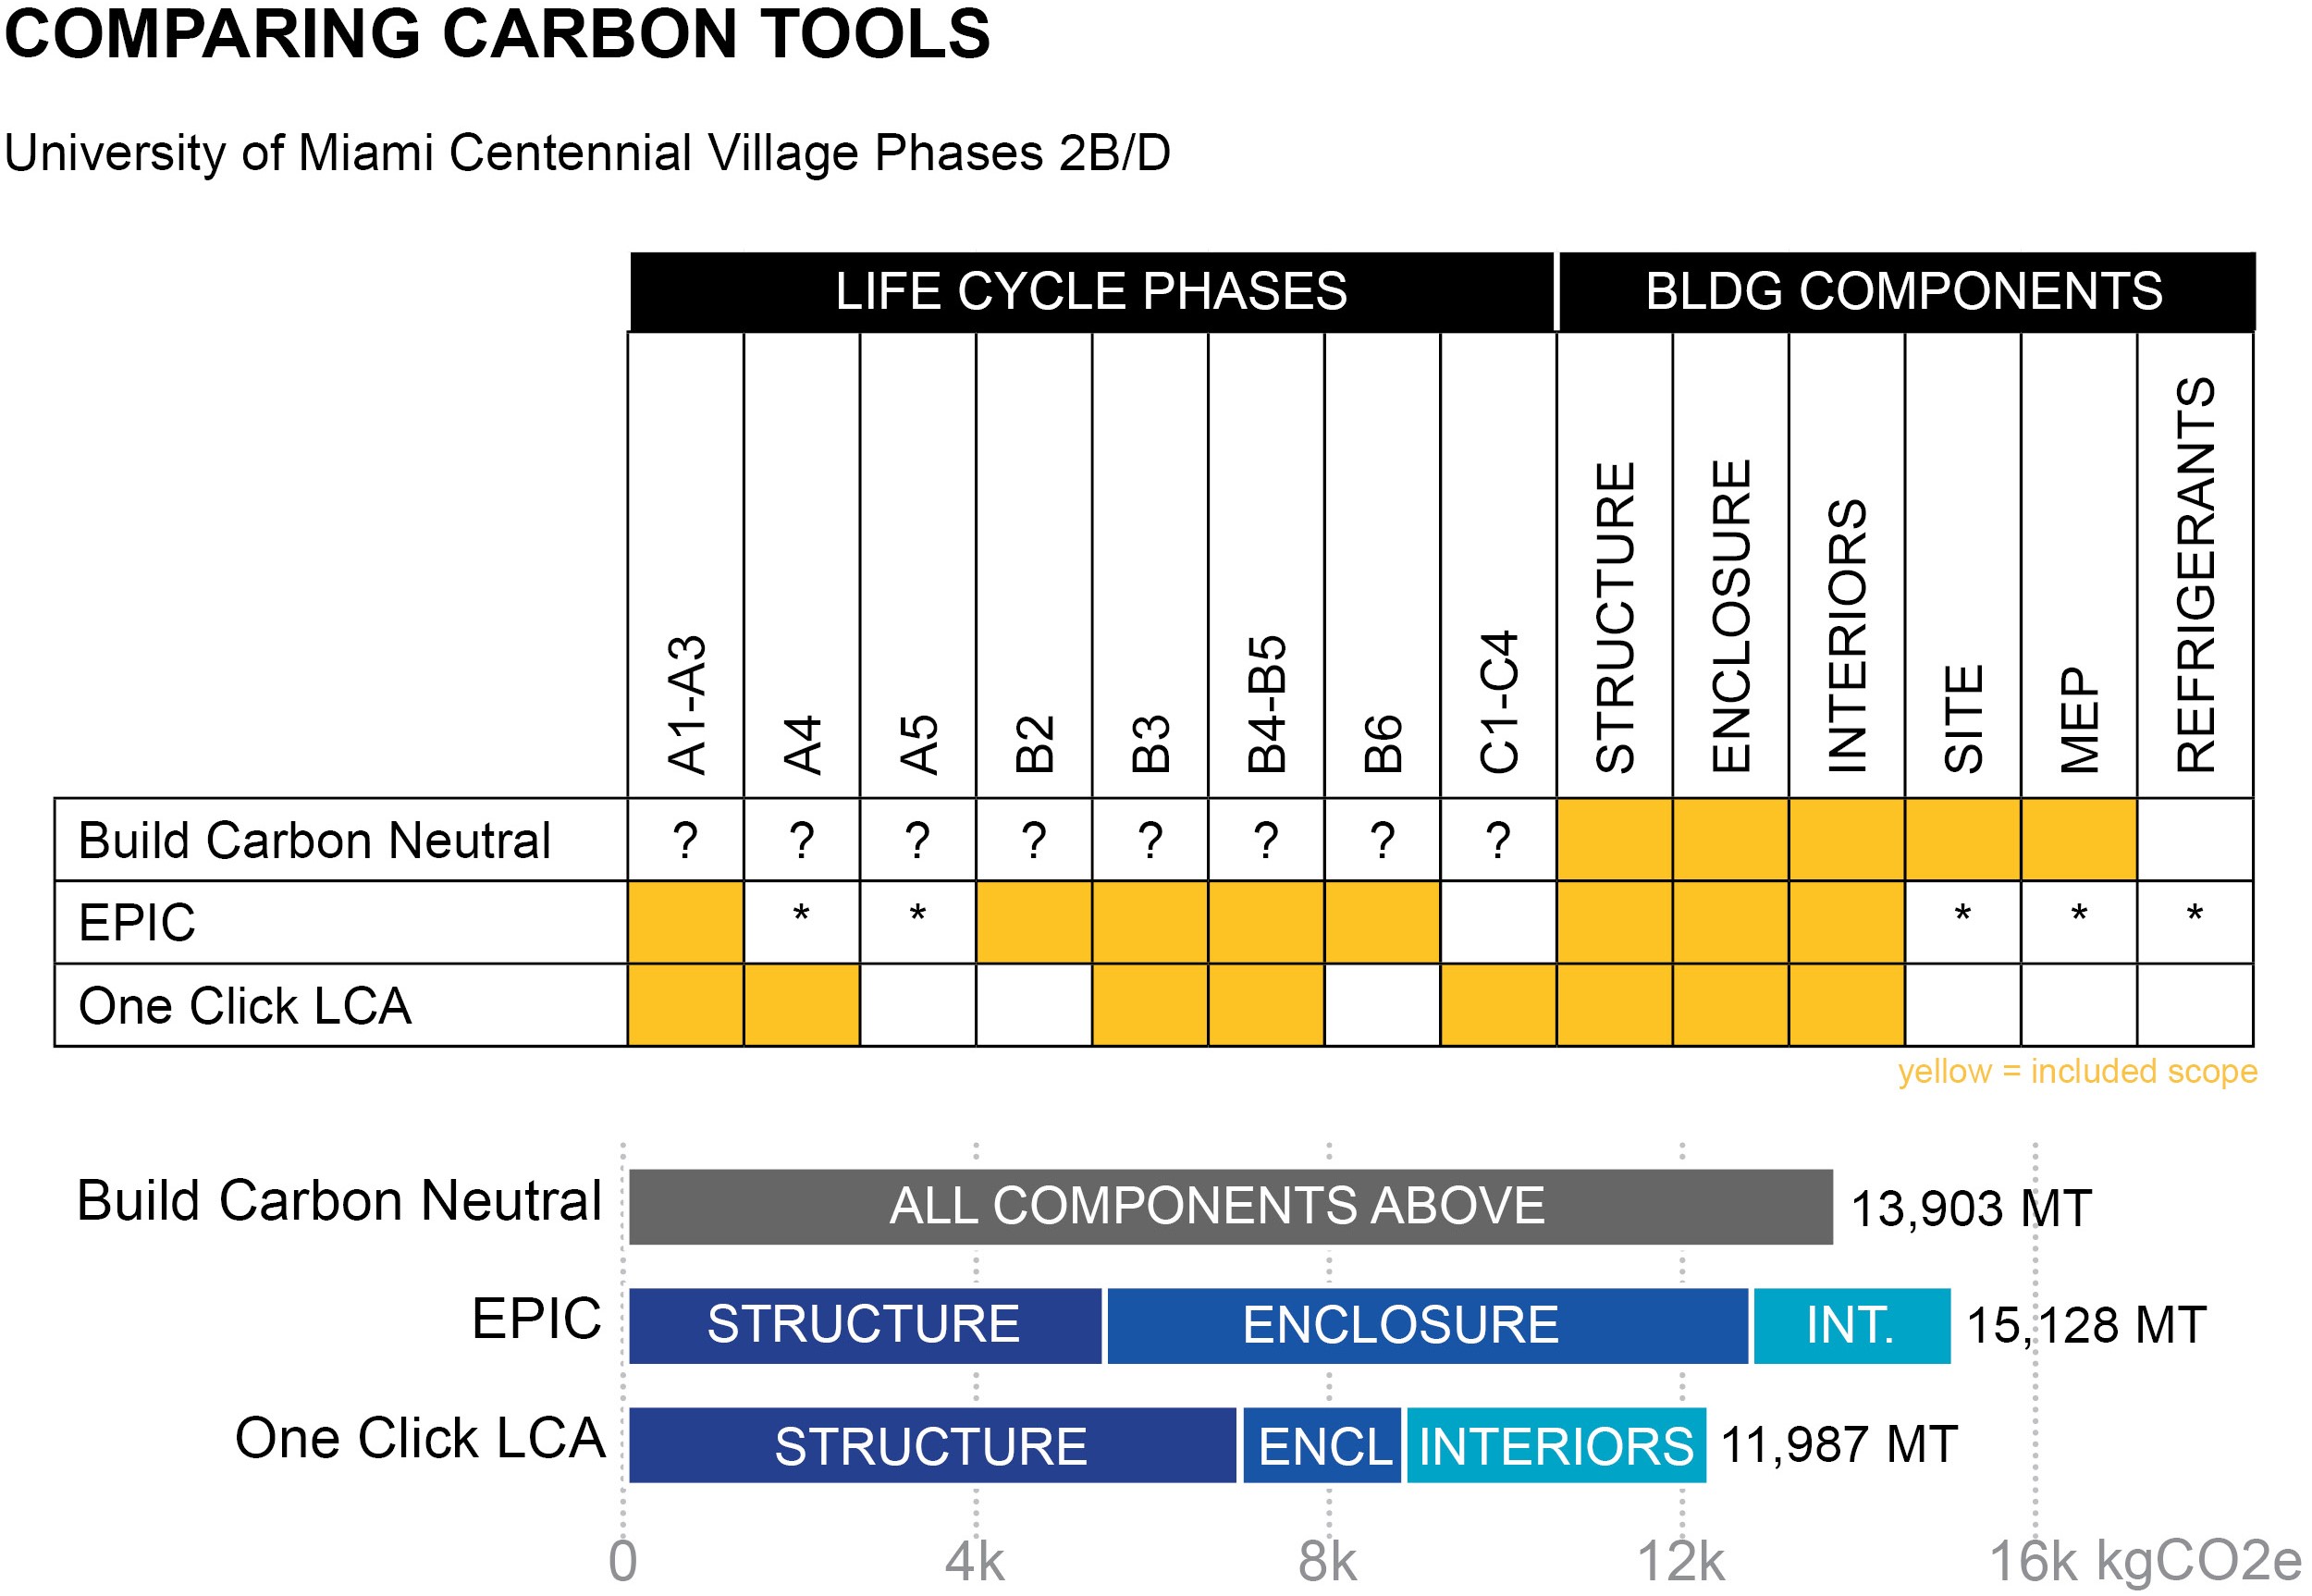
Our 2022 embodied carbon reporting used a mash-up of tools and scopes which made it difficult to compare across the portfolio. For example, our University of Miami Phase 2b/d has been modeled through Build Carbon Neutral, EPIC, and One Click LCA (* indicates the scope is available in the tool but not accounted for in this analysis):
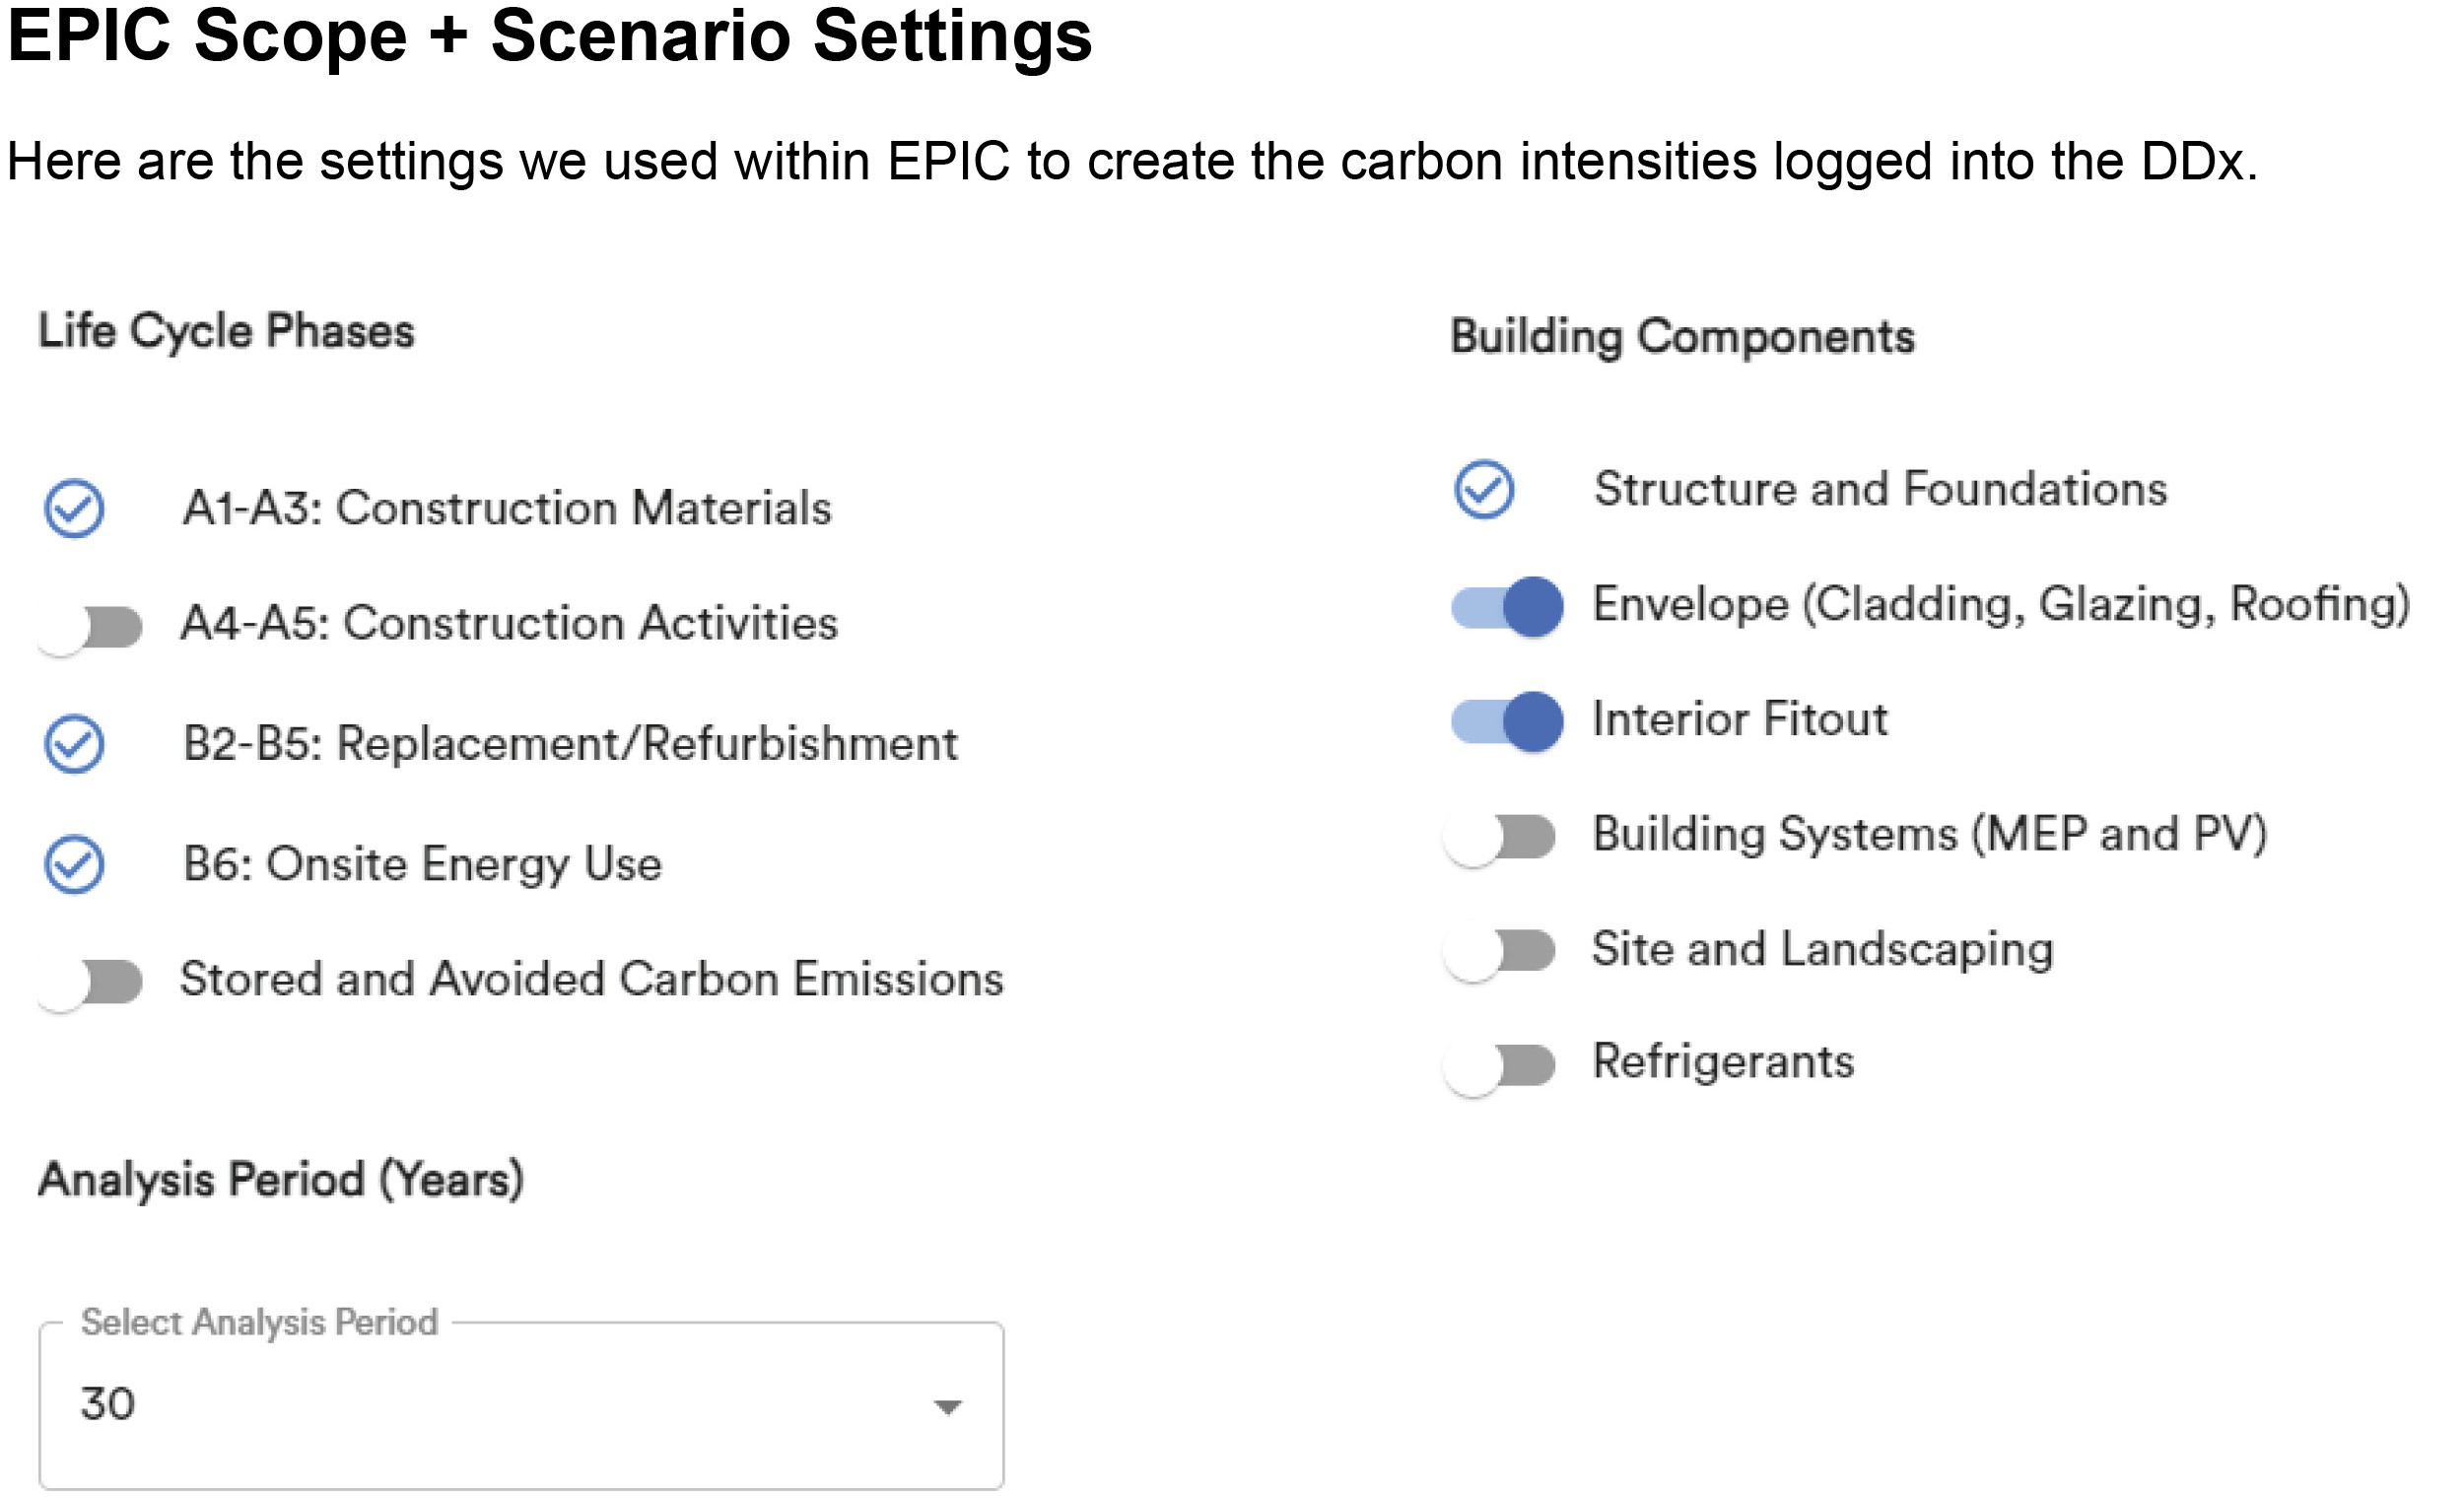
To regularize calculations to see what we could learn, for 2023 we took the approach of running all projects through EPIC. Embodied carbon reporting has the same challenges as energy modeling: it is rare that there is transparency around assumptions in the models presented. In the spirit of radical transparency, here are the assumptions behind our calculations.
- If we could have limited the scope to only A1-A3 in EPIC, we would have (to focus the discussion on upfront carbon).
- We excluded MEP/PV and refrigerants to focus on the aspects that are fully within the architect’s scope. I anticipate adding these back in as we move forward.
- We also excluded site and landscaping, not because it’s not important, but because we did not want to skew the results for projects in less dense locations. In 2024 we hope to look at landscape carbon in more detail using tools like Pathfinder and/or Carbon Conscience.
- We excluded stored/avoided carbon emissions because too many of our projects are not achieving FSC certified wood. At the SD level of this tool, we should not get credit for sequestration if we can’t confirm the project will be able to incorporate this in the project budget.
- We kept the 30-year analysis default, despite EPIC having added a 60 year option, because of the urgency of near-term carbon emissions.
For the proposed scenarios, unless there was something exemplary on the project we used best practice specifications for concrete, steel, envelope and fit-out. The only variation from EPIC’s default was on the refurbishment cycle for interiors as our clients tend to go a little longer (we used 20 years instead of the default of 10 years).
Here is a breakdown of our portfolio’s embodied carbon intensity (in kgCO2e/sf—I know, I KNOW, it should be in kgCO2e/m2, but our data is sorted this way so we can roll it up into a total carbon figure, and people understand EUI in square feet, not square meters. Don’t shoot the messenger, just multiply the figures below by 10.8 to get kgCO2e/m2.)
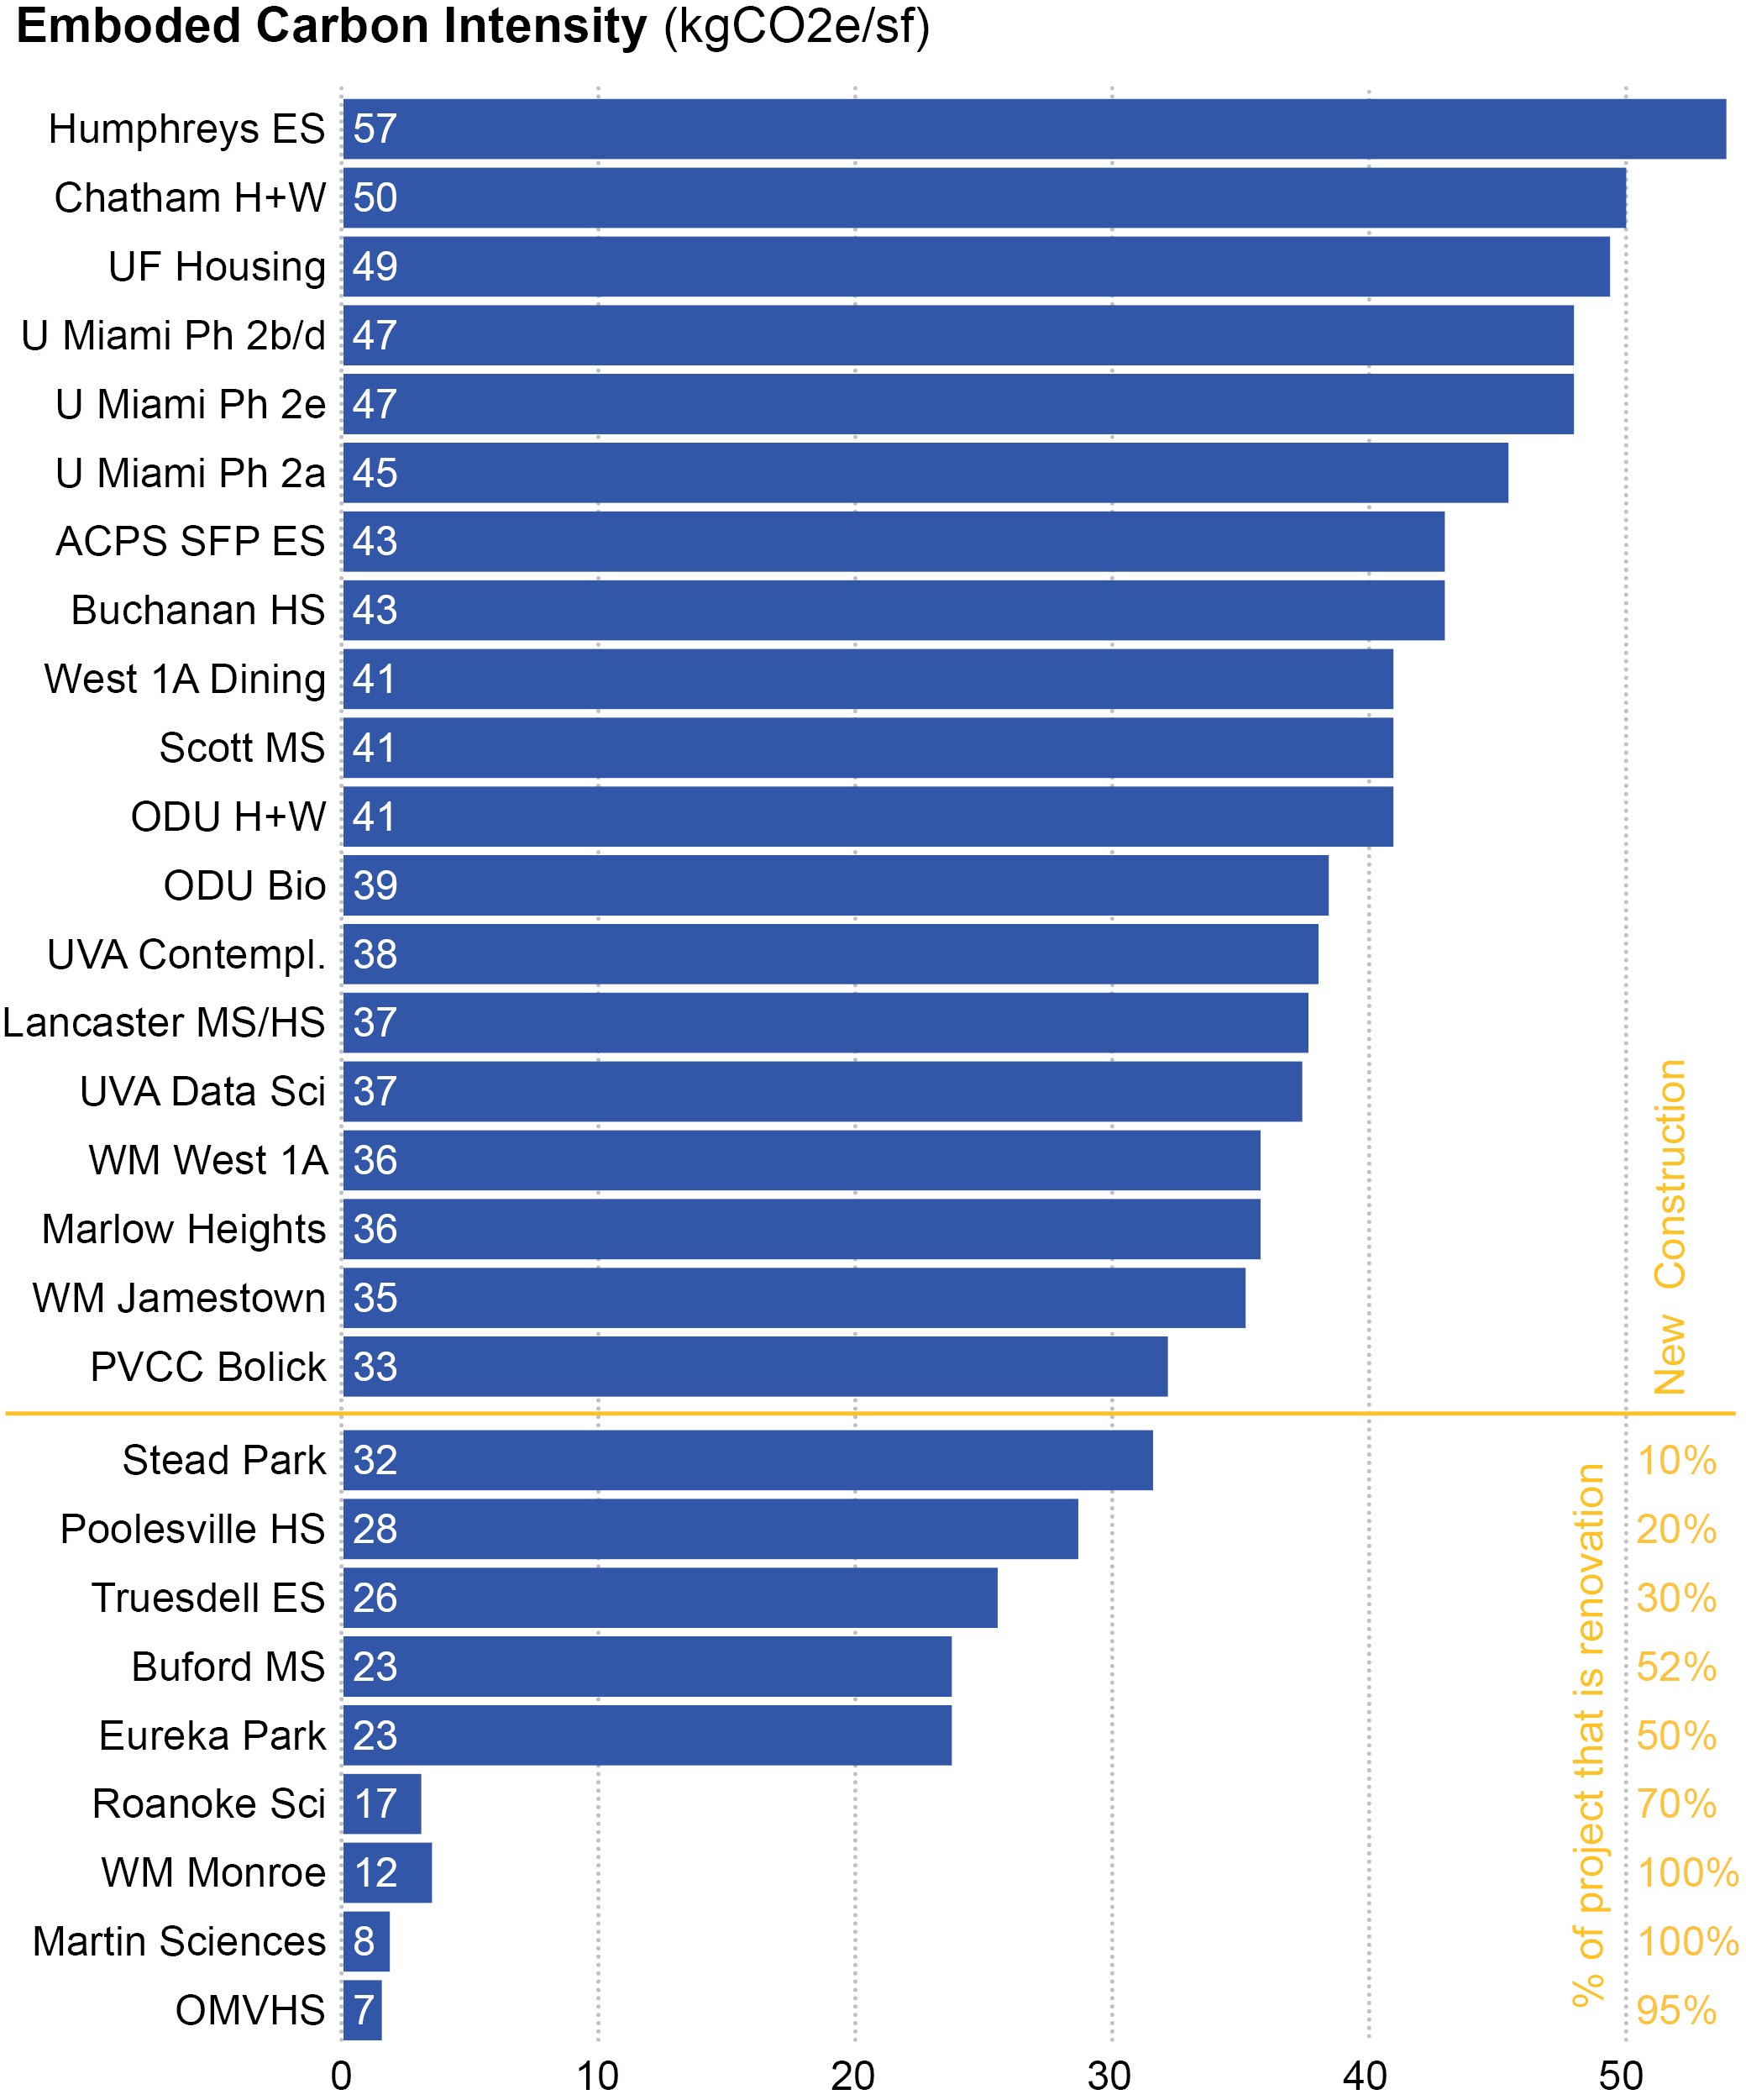
The lessons we learned are not surprising:
- Renovations have lower embodied carbon
- Location matters (for example, the highest carbon intensities shown are in far southwest Virginia, Florida, and Korea)
Where it really gets interesting is when you put the operational and embodied carbon calculations together, which is what EPIC does so well.
Total Carbon
“It really doesn’t matter what the baseline is or how much you’ve reduced against it. What we’re really trying to get to is zero carbon emissions. Zero is zero.” - Jesse Walton, 2030 Commitment Co-Chair
The numbers below are both incomplete and imperfect, but in a world of fast schedules, tight budgets, and mounting climate anxiety, looking at total carbon helps us to focus on where we can have the greatest impacts. These are the project carbon intensities for VMDO’s 2023 portfolio, using EPIC’s default future scenario for grid decarbonization (NREL CAMBIUM model Midcase scenario):
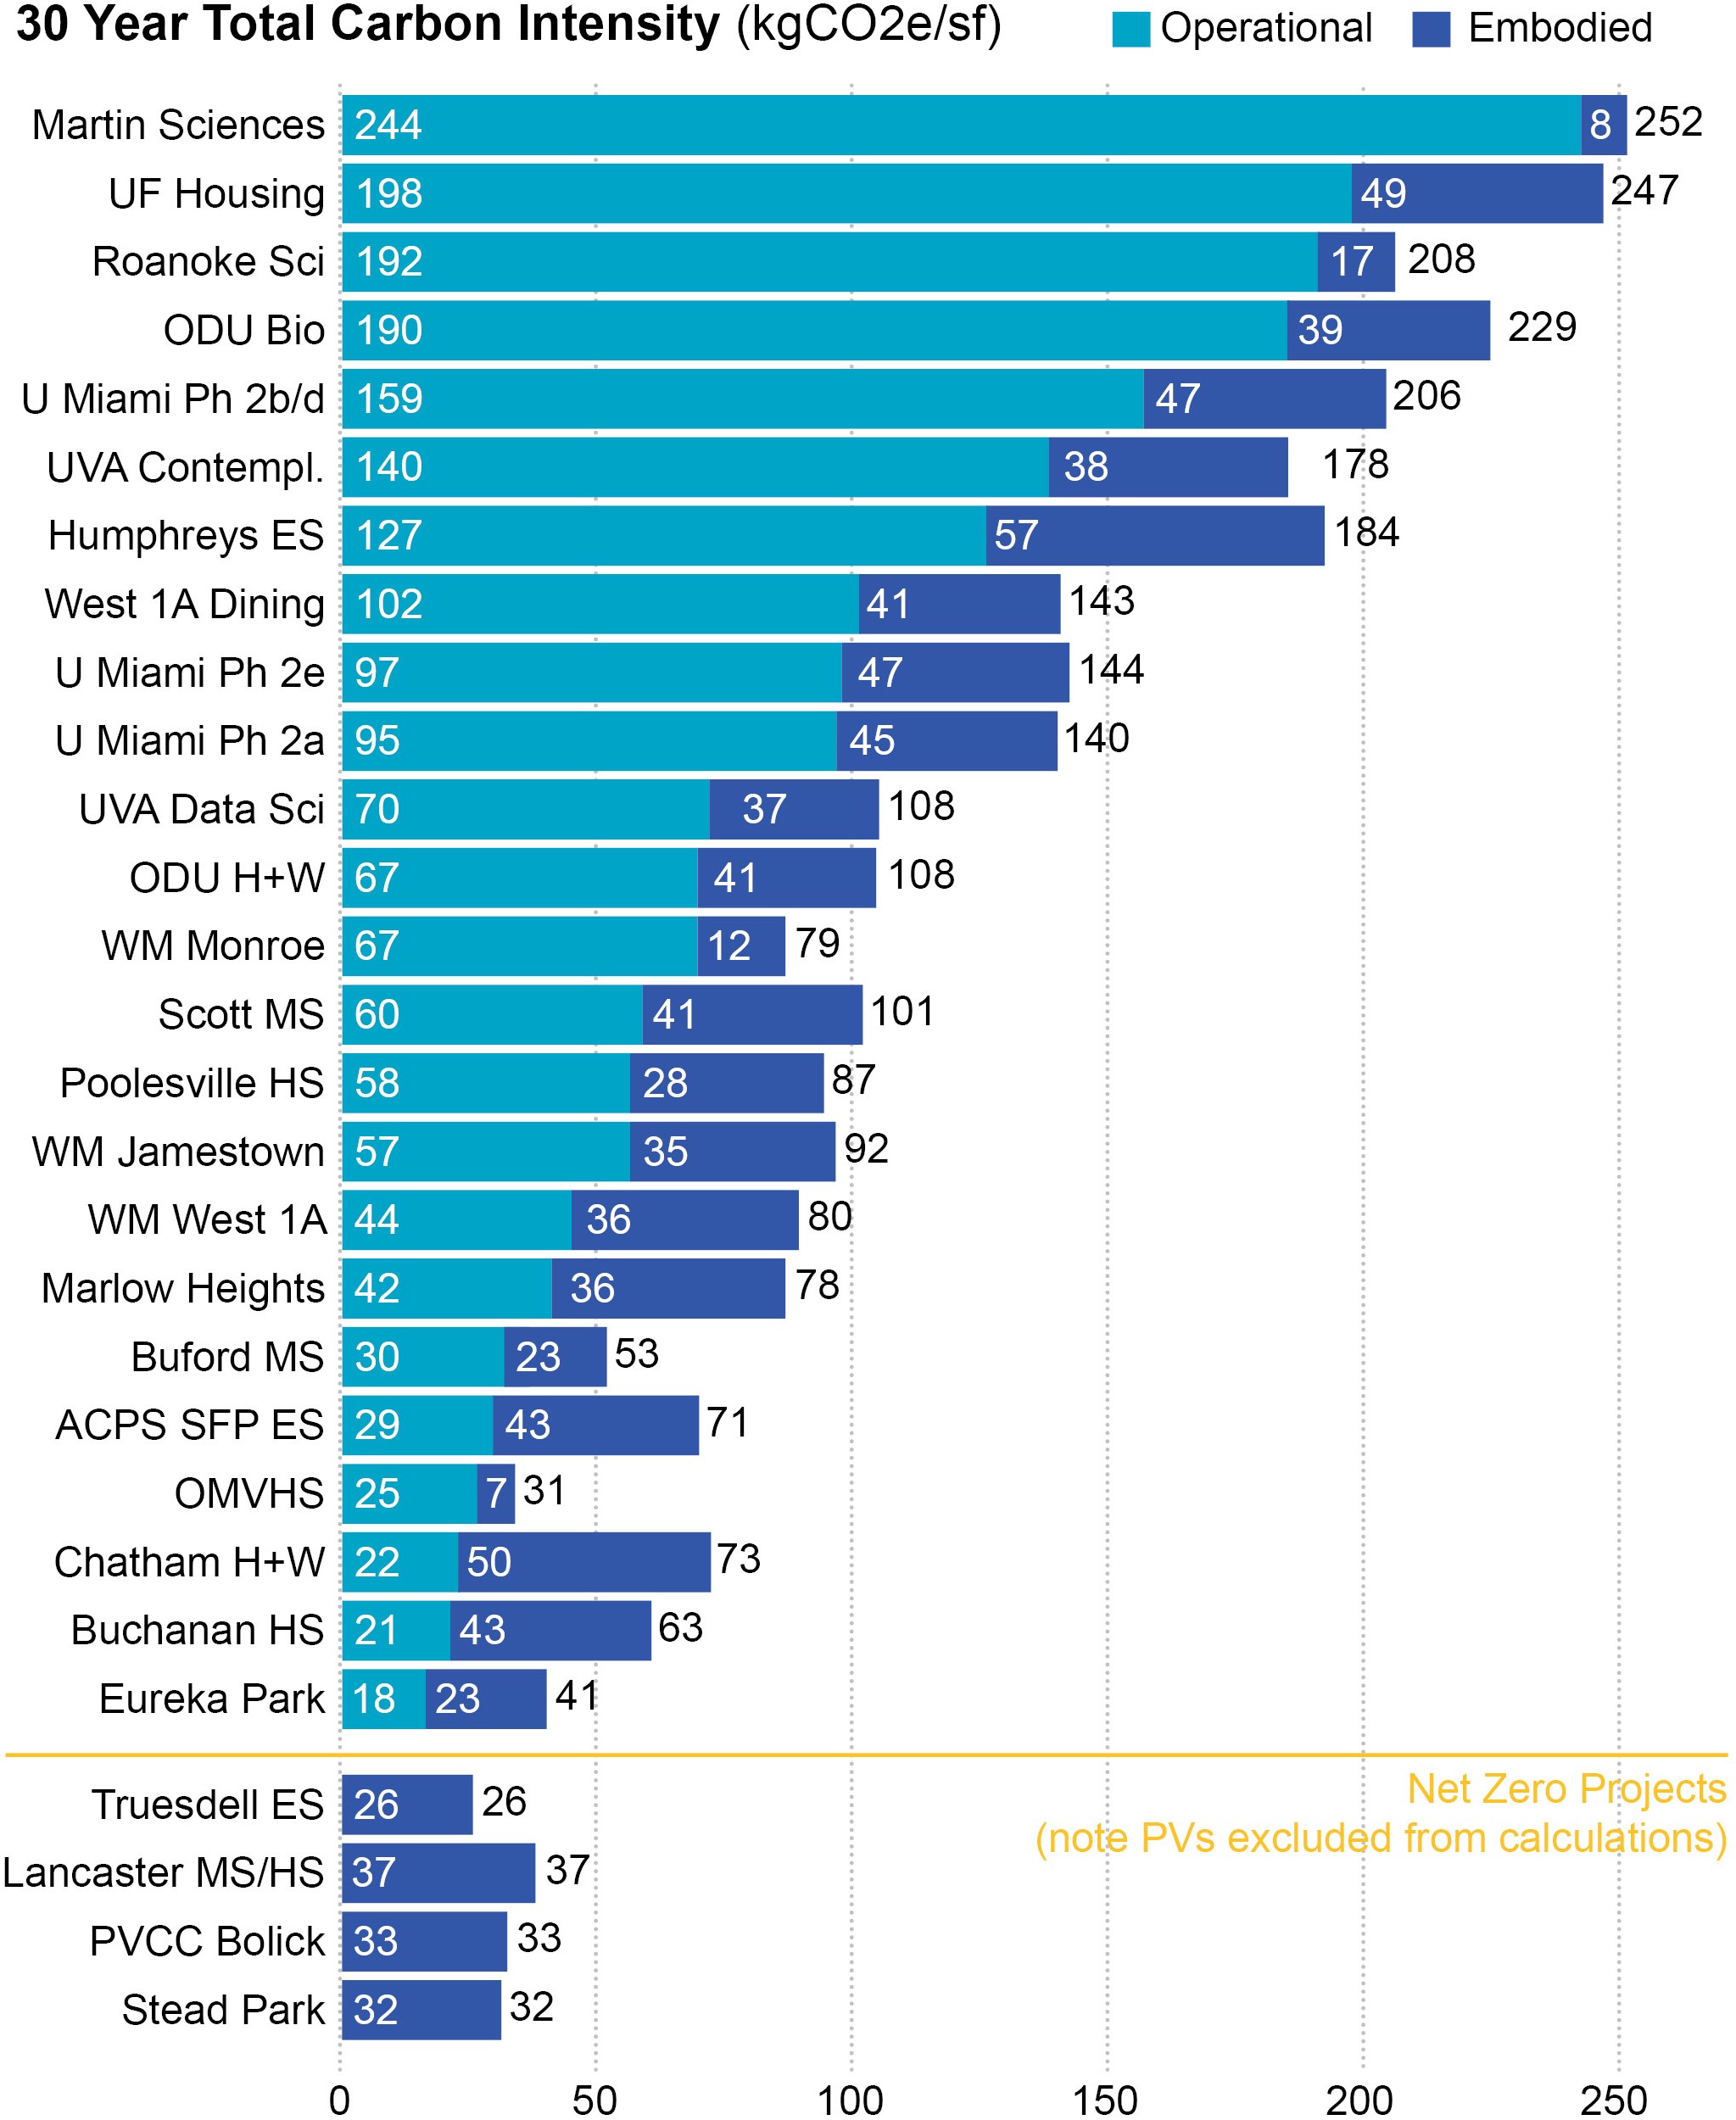
You might look at this list and notice the net-zero energy projects at the bottom have the lowest total carbon numbers and say to yourself, “See? Net-zero energy is still the best approach.” Don’t be fooled, friends: remember how we excluded MEP from the scope? It means that the embodied energy of the PV array isn’t included here. As always, it goes back to data transparency: knowing what is inside and outside of the scope of study and how things are modeled. It also shows the limitation of “simple” tools like EPIC and the need for more detailed analysis of specific designs with tools like One Click LCA.
Part 4: What’s Next?
VMDO is developing its first Strategic Plan, and we’re using this as an opportunity to revamp the Sustainability Action Plan we submitted when we signed on to the 2030 Commitment in 2017. The Strategic Plan will include a 5-year action plan for improving our processes around carbon, performance, resilience, and health) and establishing targets and stage gates. The goal is to push low-carbon, healthy and resilient design considerations and tools into earlier phases of the design process AND to drive those same considerations through construction, resulting in better actual outcomes, not just better modeling/reporting.
We’re also building our staff’s carbon literacy, using LMN’s excellent Path to Zero Carbon series as a kind of book club, meeting every few weeks to discuss 2-3 posts at a time. It has brought into focus the next frontier of initiatives (or, rather, what is currently missing from what we’re tracking, such as refrigerant selection, MEP embodied carbon, site and landscape, FFE). Post 6: Buildings, Energy Use + Carbon sums up succinctly how zero energy buildings are not zero emissions buildings and points out how important timing is to emissions impact. In the end, it all comes back to Nadav’s sage observation: “reasonable energy efficiency, electrification, grid interactivity, and embodied carbon is where we should be focusing.”
Finally, even though they are incomplete and imperfect, the emissions numbers we're inputting to and outputting from the DDx trigger yet another moment of Absolute Candor: once you see them, you can’t unsee them. Our portfolio’s annual operational emissions—where we have been laser focused since joining the 2030 Commitment — are a tenth of its embodied emissions. Approximately 134,000 metric tons of carbon dioxide equivalent will be emitted in its construction*** and first year of operation, requiring over 150,000 acres of forest to remove it from the atmosphere (an area that is slightly larger than Chicago, or Manila).
It’s easy to feel daunted by the scale of the challenge. In these moments, I go back to a favorite quote from Zen and the Art of Saving the Planet:
"We may feel immense pressure to save the planet in this lifetime, and we may be afraid that we can never do enough. The stark truth is that the planet doesn't need to be saved only once; it needs to be saved countless times, for eons to come. It's impossible to save the planet once and for all, all on our own. That the planet that is here now is a miracle, born of countless favorable causes and conditions over billions of years. And the planet will continue to need countless favorable causes and conditions going forward. This realization is good news. We belong to a stream of life, and this moment is our time and our turn to do our part, and to do whatever we can to pass on what we learn to future generations, so they can do theirs."
It’s on us to create those countless favorable conditions. To do this, we all need to:
- Publish our data...and be specific. Data transparency is the only way we are going to learn from each other, and it is the best way to hold ourselves accountable. We should all be publishing our data whenever possible.
- Step back from energy and embrace emissions. The move from energy use (kBTU) to emissions (kgCO2e) is a game-changer. It’s time we all start thinking about our work in terms of emissions, not energy bills.
- Keep trying. Not every project is going to hit the 2030 target; it does not mean we should not try. Missing the target on a project is not necessarily a failure.
- Commit. Signing on to the 2030 Commitment has revolutionized how VMDO practices. If you have not signed on, you should. At VMDO, the Commitment gave the sustainability team the leverage to change how we work and created a common language for discussing project performance/success.
Check back here next year for an update on how VMDO is doing.
_________
**From last year’s blog: Our exception to using Zero Tool baselines is residence life. Residence life is not well-represented in CBECS 2003: there are only 13 residence halls between 65,000-200,000 sf in the database and most were constructed before 1979. Because of the increased ventilation rates in residence halls required by current codes (most CBECS halls are unventilated) and the wide variability in energy demand based on typology/density (suite verses semi-suites verses traditional configurations), we rely on ASHRAE 90.1-2013 Appendix G to establish our 2030?baseline.
***and repair and replacement of those materials (B2-B6) – I told you, incomplete and imperfect numbers.
